I invented a new instrument: The Qweremin is a qwerty theremin.
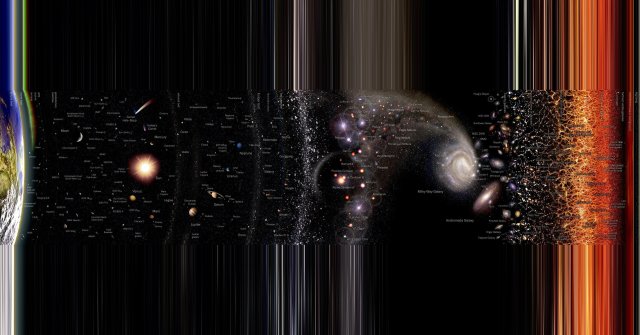
It’s a long way from planet Earth to the Universe’s edge.
The extent of the visible Universe now goes on for 46.1 billion light-years: the distance that light emitted at the instant of the Big Bang would be located from us today, after a 13.8 billion year journey. As time marches on, light that’s even farther away, that is still on its way to us, will eventually arrive: from slightly greater distances and with slightly greater redshifts. We see into the past when we look out to great distances because the light emitted from distant objects must traverse those great intergalactic distances at a finite speed: the speed of light.
Our tiny home world, seemingly massive, is merely 12,742 km (7,917 miles) across.

This image, taken from the International Space Station by astronaut Karen Nyberg in 2013, shows the two largest islands on the southern part of the Mascarene Plateau: Réunion, in the foreground, and Mauritius, partially covered by clouds. To see a human on Earth from the altitude of the ISS, a telescope the size of Hubble would be needed. The scale of a human is less than 1/5,000,000 the scale of Earth, but Earth is just a proverbial drop in the cosmic ocean, with a diameter of only a little over 10,000 kilometers.
We typically think linearly: where the Sun is ~10,000 times farther away than Earth’s diameter.

While all of the planets in the Solar System orbit the Sun in the same direction, Venus, uniquely, rotates in the opposite direction. For each orbit completed by Venus, although it is the slowest-rotating planet, it experiences roughly two “days” of sunrises and sunsets.
But cosmically, logarithmic scales — where each multiplicative factor of “10” defines our cosmic ruler’s next mark — serve us far better.
The Earth, at nearly 13,000 kilometers (8,000 miles) in diameter, is tiny compared to the cosmic distances between the Earth-and-Moon or, more spectacularly, the Earth-and-Sun. But a logarithmic scale gives us a vastly different perspective, enabling us to reckon with disparate distance scales in a single visual image.
On a logarithmic scale, the Sun, Mercury, and Mars are practically equidistant.
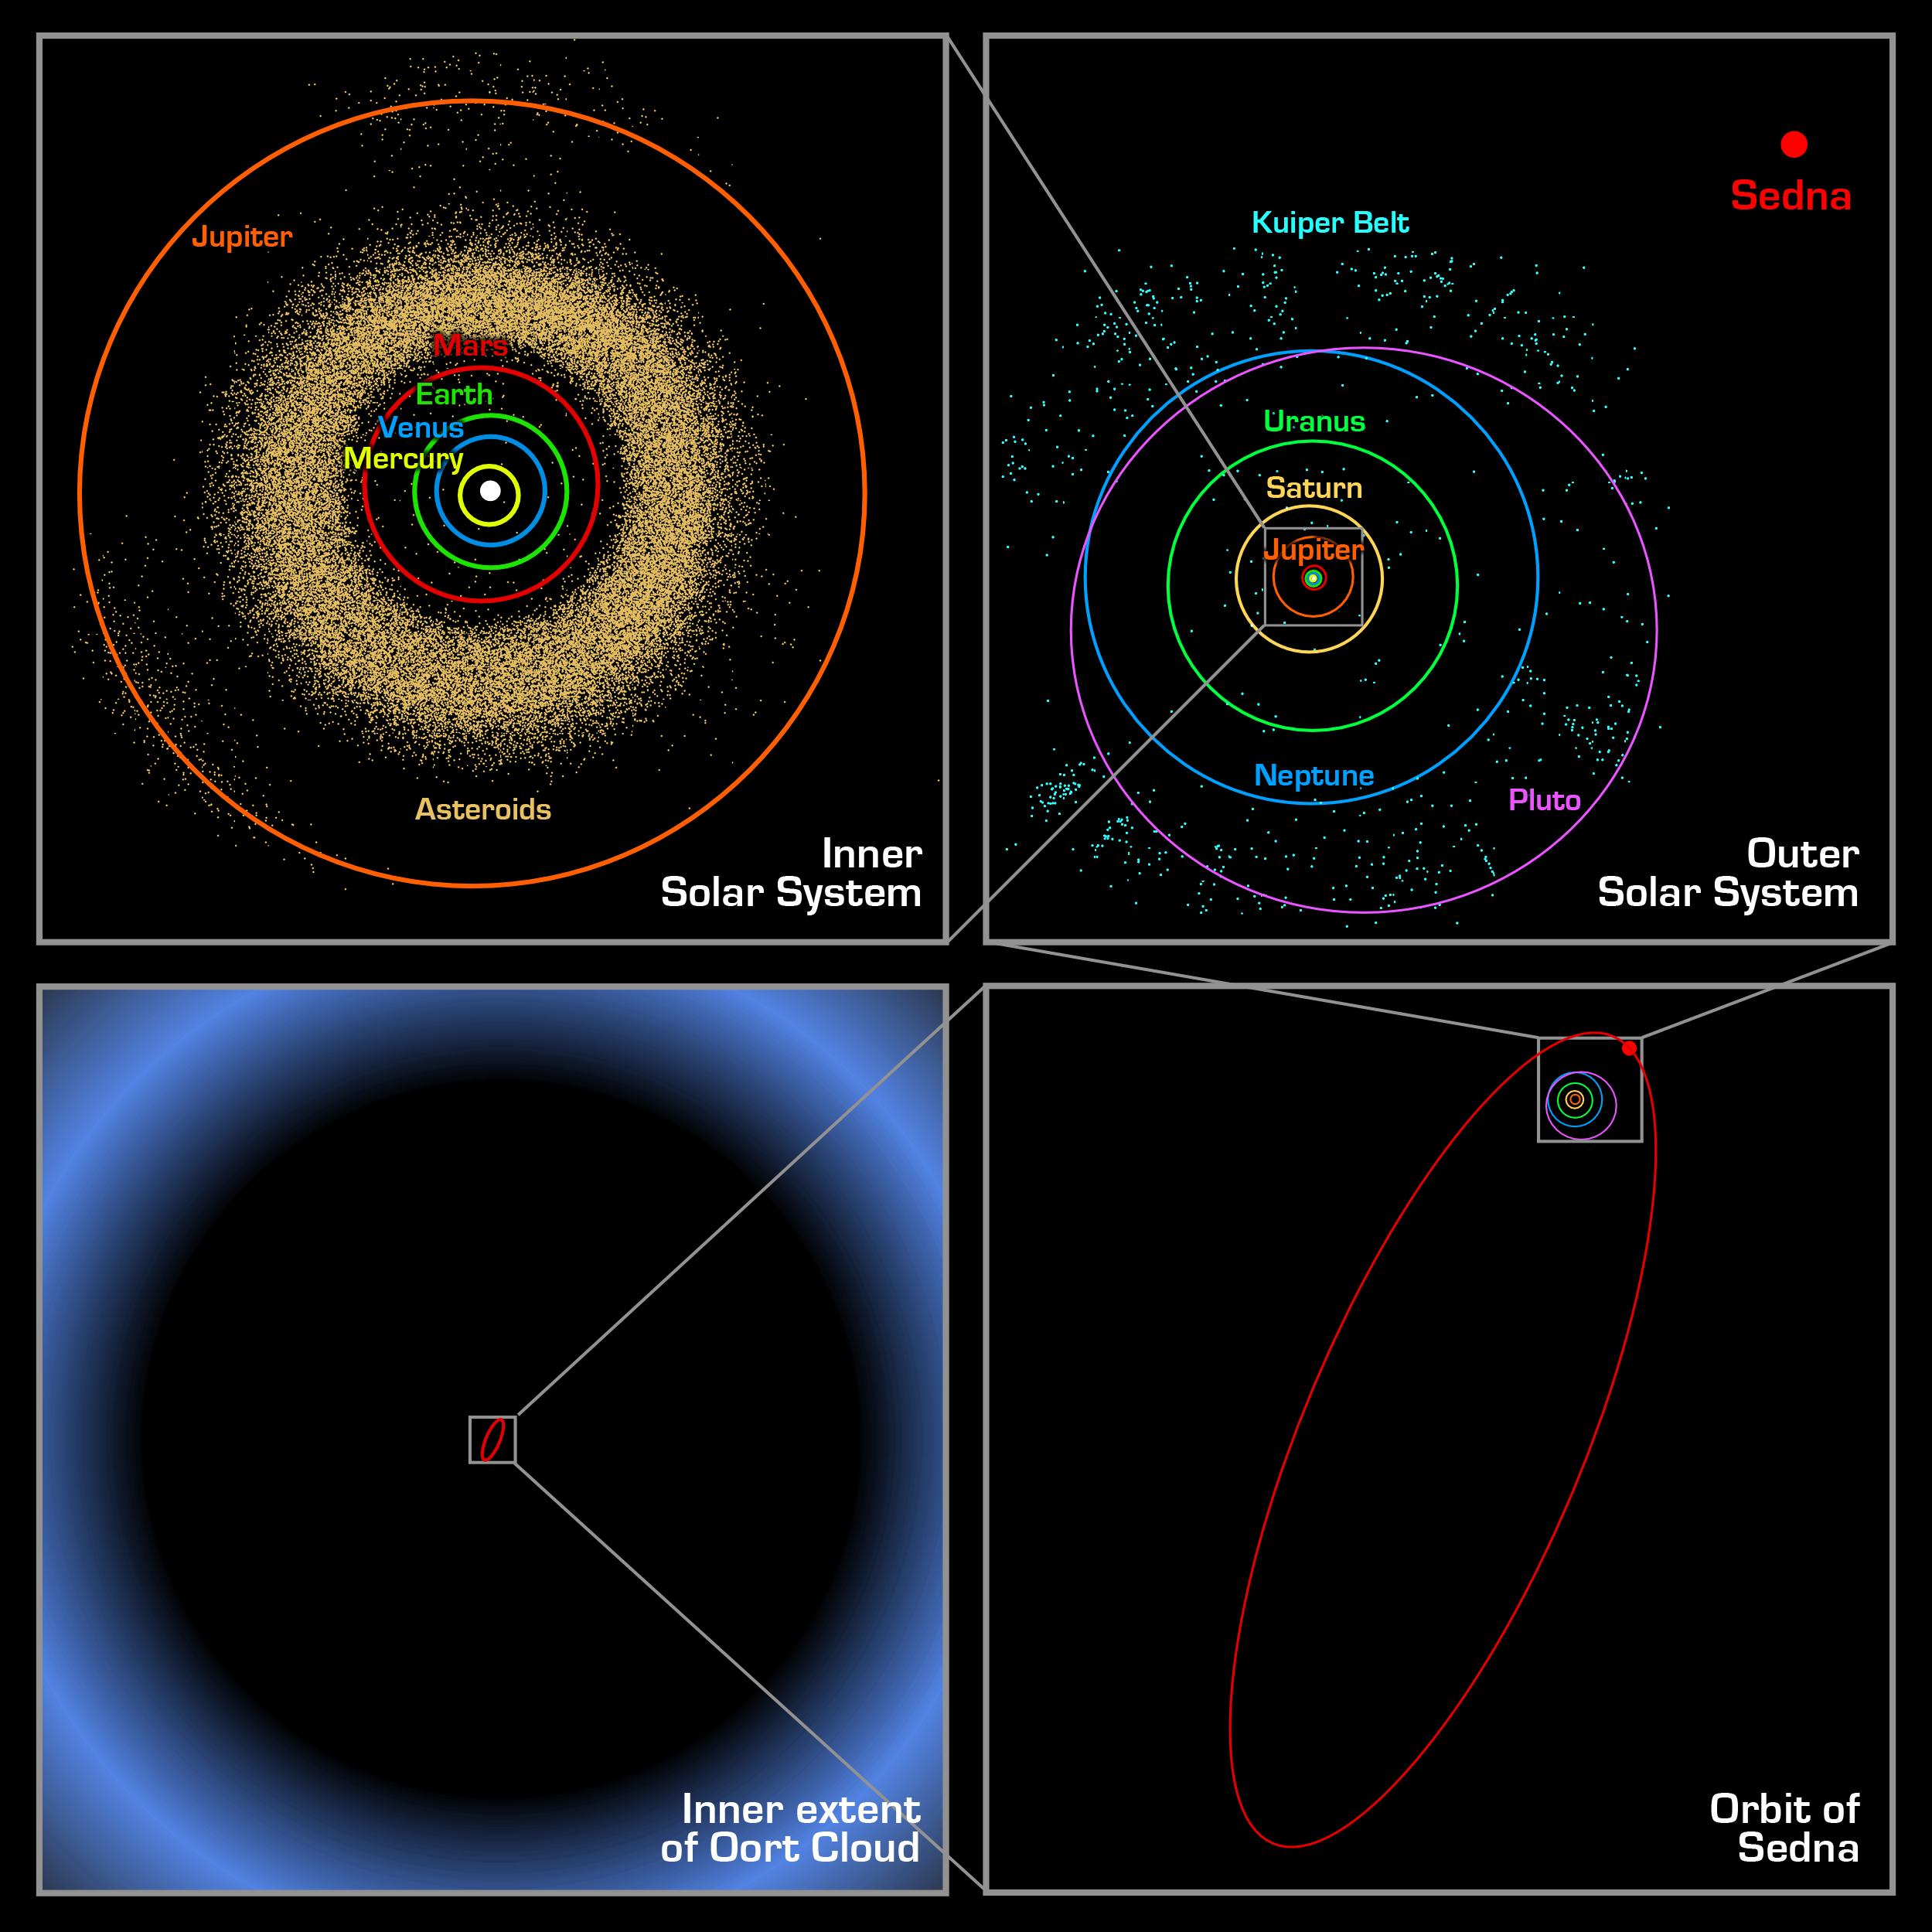
The inner Solar System, including the planets, asteroids, gas giants, Kuiper belt, and more, is minuscule in scale when compared to the extent of the Oort Cloud. Sedna, the only large object with a very distant aphelion, may be part of the innermost portion of the inner Oort Cloud, but even that is disputed. On a linear scale, depicting the entire Solar System in a single image is incredibly limiting; to characterize the orbit of a faraway bound object requires years or even centuries of data.
Another factor of ~10,000 in distance takes us to the Oort cloud.
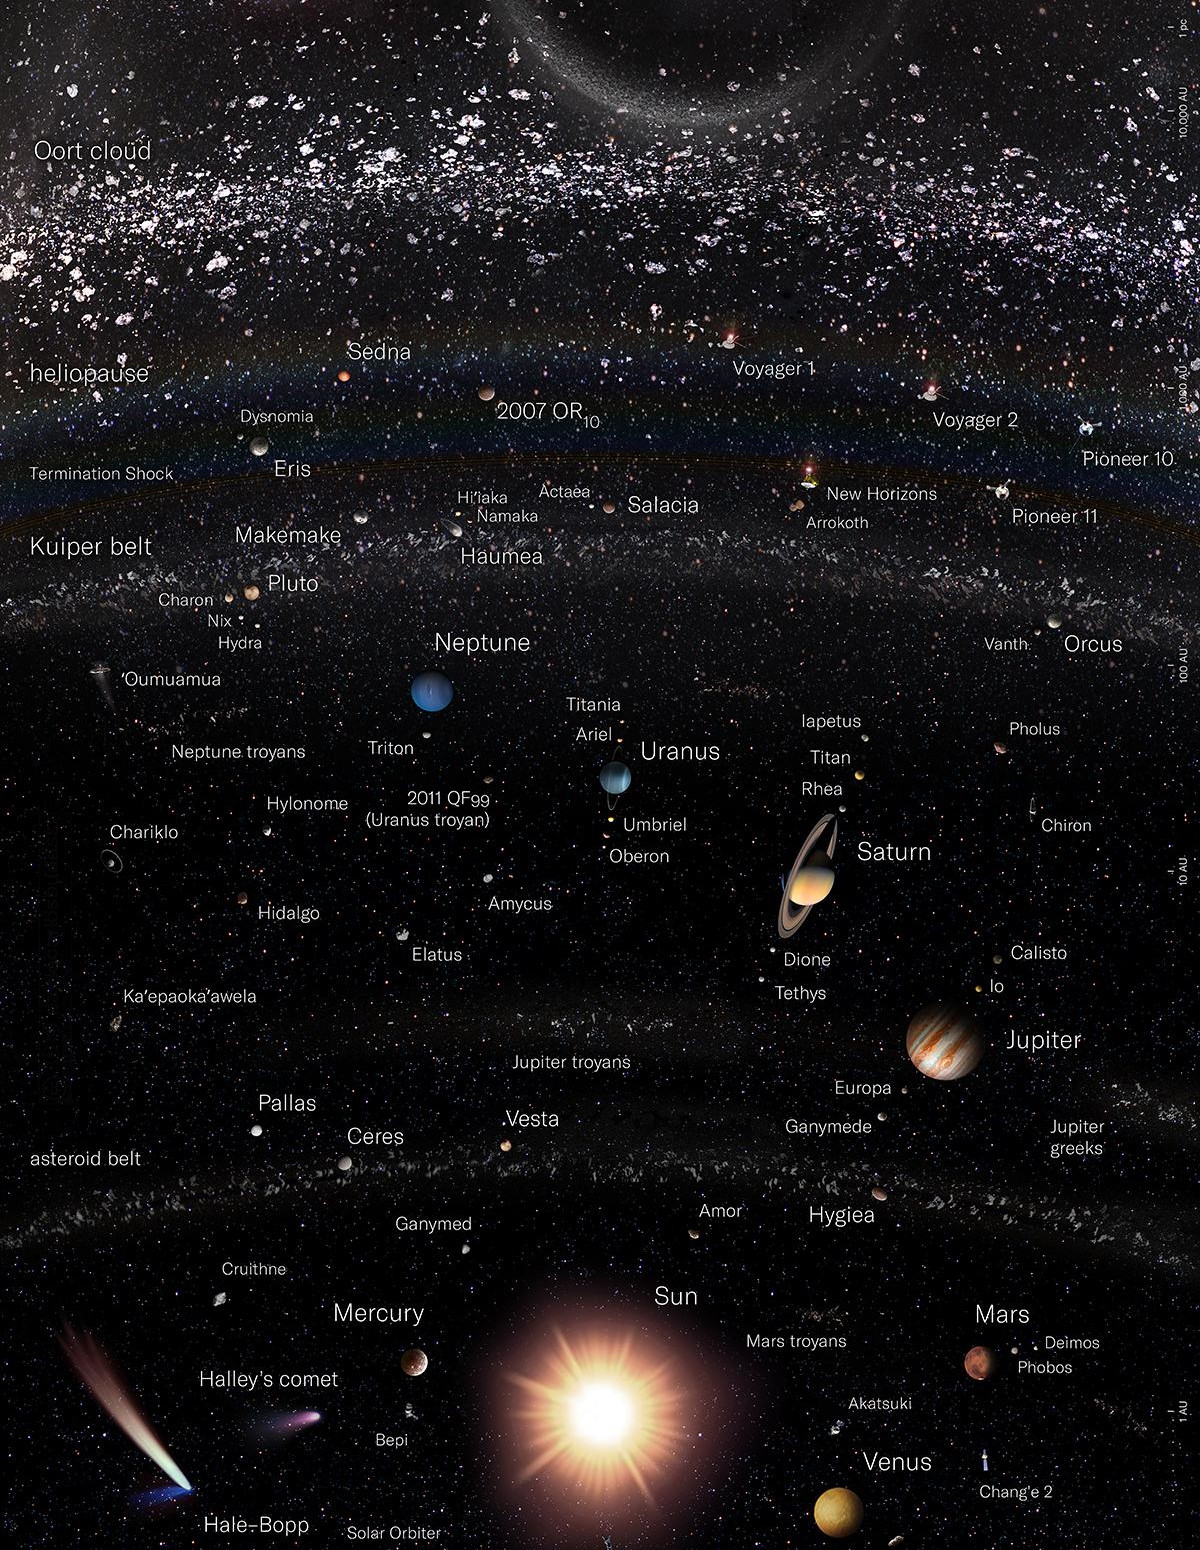
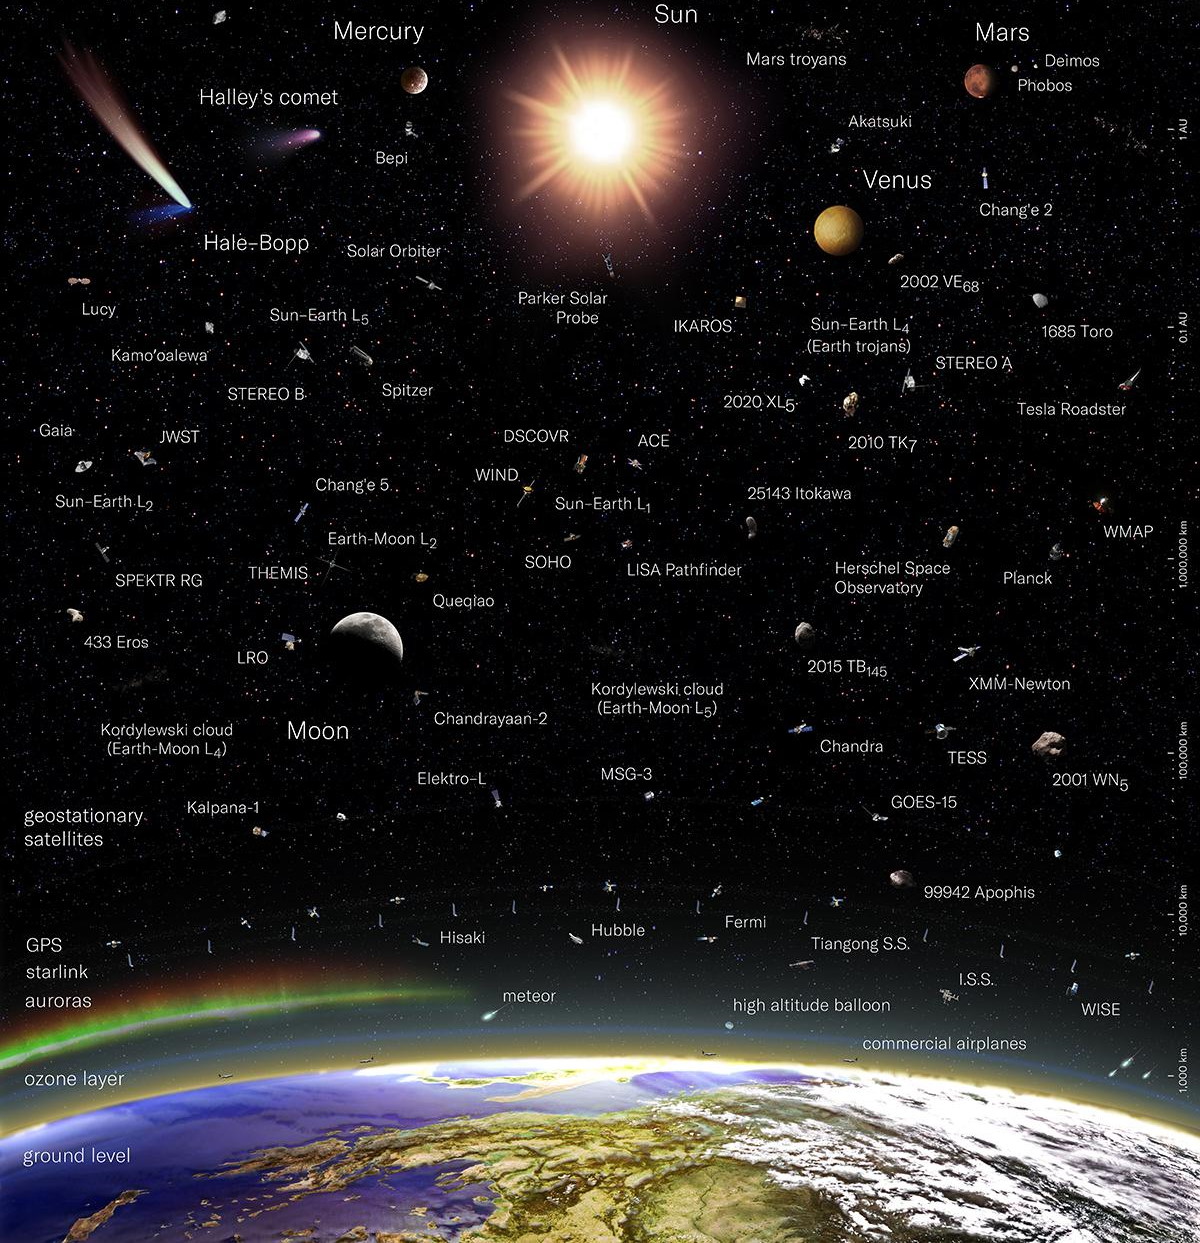
In the Solar System, we typically measure distances in Astronomical Units (AU), where the Earth-Sun distance is 1 AU. Mercury and Mars are also about ~1 AU from Earth, with Saturn at ~10 AU, the Kuiper belt ending before ~100 AU, and the Oort cloud largely existing at ~10,000 AU. It’s an enormous distance on a linear scale, but only a small set of “factors of 10” away on a logarithmic one.
A short logarithmic jump takes us from the Solar System to the stars.

This long-exposure image captures a number of bright stars, star-forming regions, and the plane of the Milky Way above the southern hemisphere’s ALMA observatory. The nearest stars are only a few light-years away: less than a factor of 10 from the edge of the Oort cloud. But more distant stars and features, still visible with the naked human eye, can be tens of thousands of light-years away instead.
Many of the brightest stars in Earth’s skies are under 1,000 light-years away.
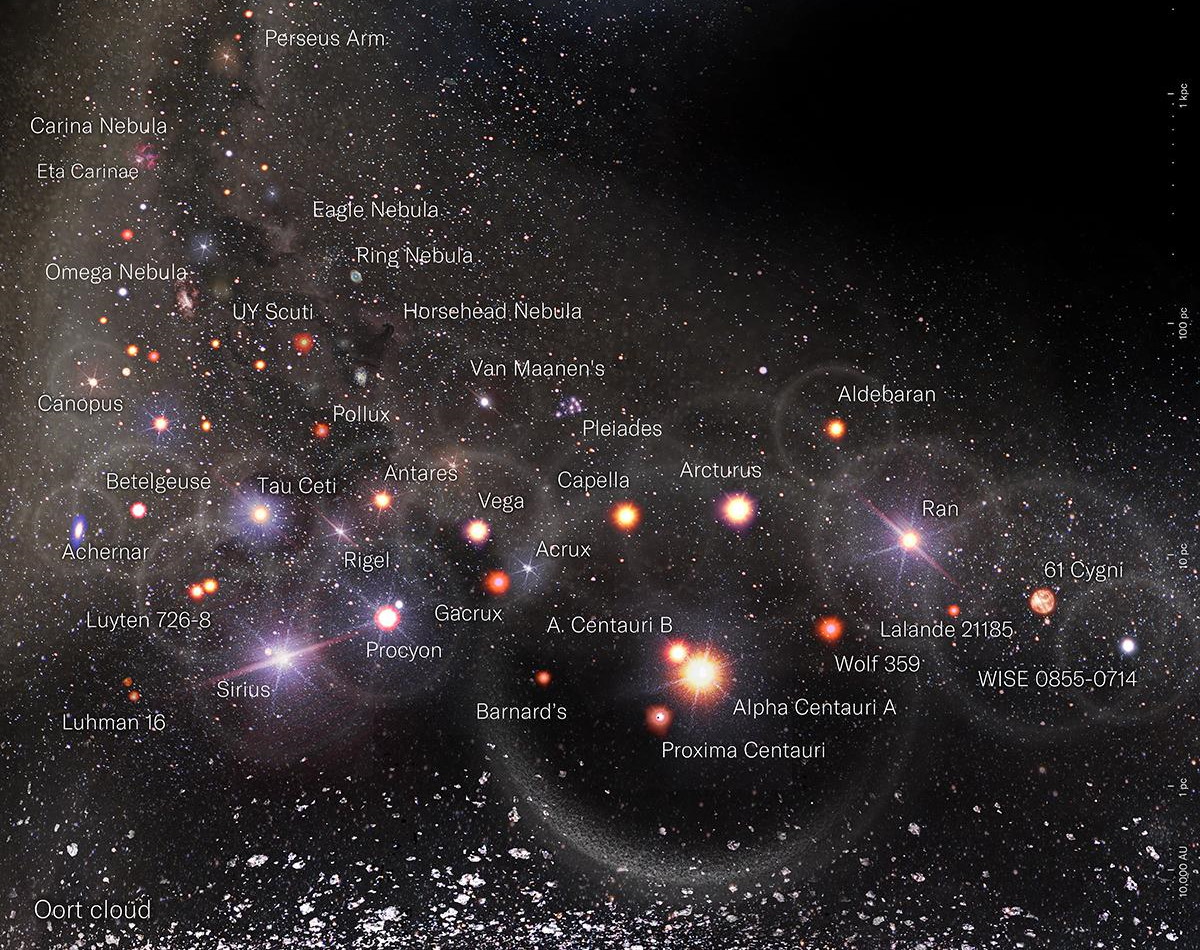
Many of the brightest nearby stars to Earth are members of the Orion arm, which itself is a minor spur of the larger, grander Perseus arm of the Milky Way. From the nearest stars, a few light-years away, to these arms, a few thousands of light-years away, represents only three factors of “10” on a logarithmic scale.
Another small logarithmic jump brings us to our nearest spiral arms.
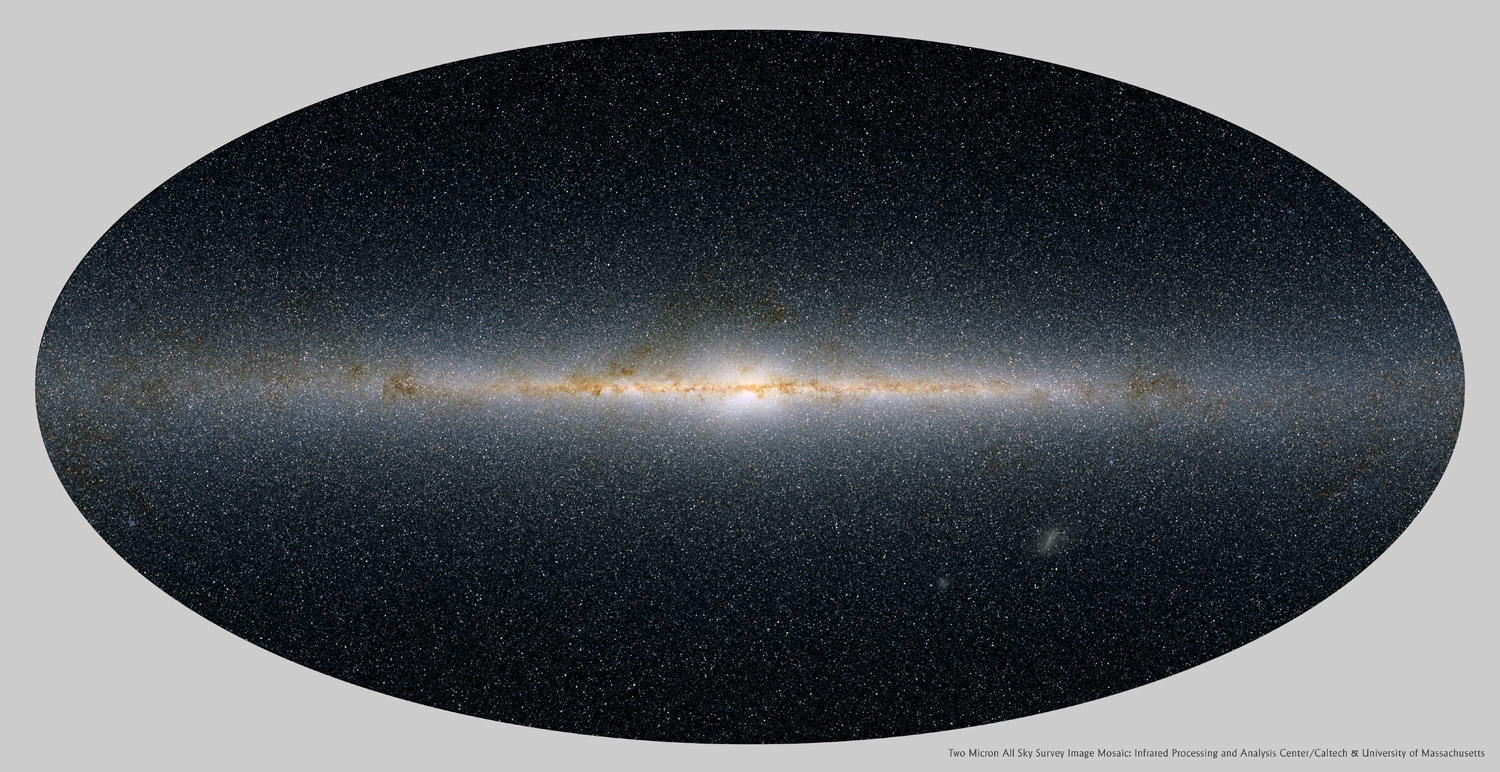
By viewing the Milky Way in infrared wavelengths of light, we can see through large amounts of the galactic dust and view the distribution of stars and star-forming regions behind them. As revealed by the 2 micron all-sky survey (2MASS), the densest collections of galactic dust can be seen tracing out our spiral arms, but the center of the plane of the Milky Way is where the dust is densest. Infrared and visible light views both showcase this, but in vastly different ways.
Beyond that lies the full Local Galactic Group.
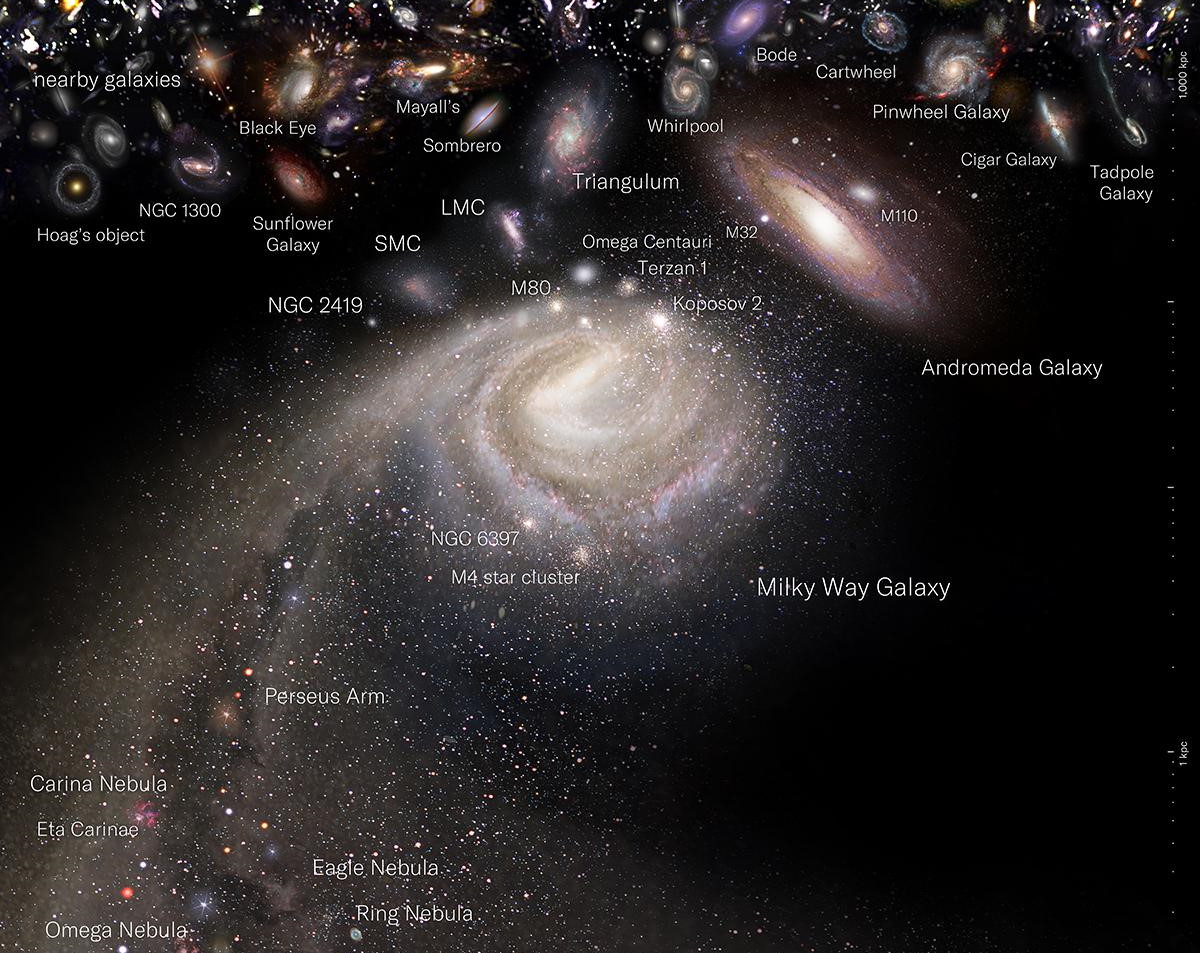
The Perseus spiral arm leads into the full-scale Milky Way, with other galaxies in the Local Group lying only a single factor of “10” beyond the full-scale Milky Way. Another factor of 10 beyond that takes us to large galactic groups and even approaches the closest galaxy cluster.
Rapidly, neighboring galaxies become ubiquitous.

This illustrated map of our local supercluster, the Virgo supercluster, spans more than 100 million light-years and contains our Local Group, which has the Milky Way, Andromeda, Triangulum, and about ~60 smaller galaxies. The overdense regions gravitationally attract us, while the regions of below-average density effectively repel us relative to the average cosmic attraction. However, the individual groups-and-clusters are not gravitationally bound together and are receding from one another as dark energy dominates the cosmic expansion.
Subsequent cosmic steps reveal large-scale galaxy clustering.
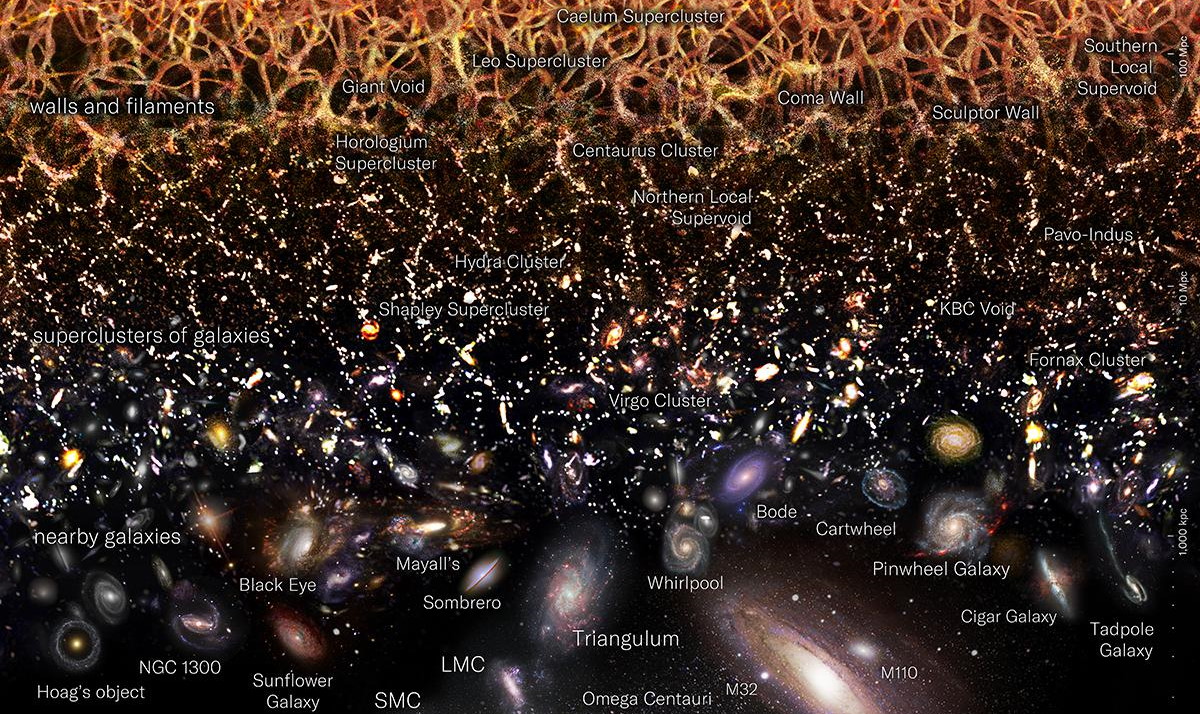
There are only a few factors of “10” in logarithmic distance that separate the nearest galaxies, located a few hundred thousand to a few million light-years away, to large-scale clustering features on the scales of hundreds of millions or possibly one billion light-years. At these scales, the Universe’s largest bound features begin to come into view.
Eventually the largest structures of all are revealed: the great cosmic web.
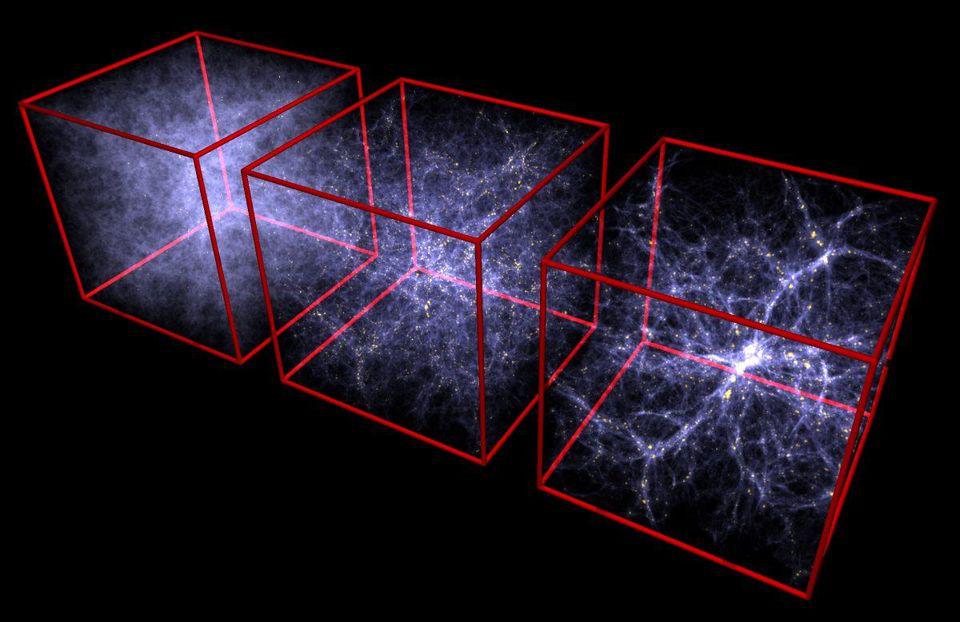
Over time, gravitational interactions will turn a mostly uniform, equal-density Universe into one with large concentrations of matter and huge voids separating them. For as long as radiation is still important, exerting an outward pressure even once the Universe becomes matter-dominated, the growth of matter imperfections is very small.
Many of these features are only apparent: dark energy will tear these pseudostructures apart.
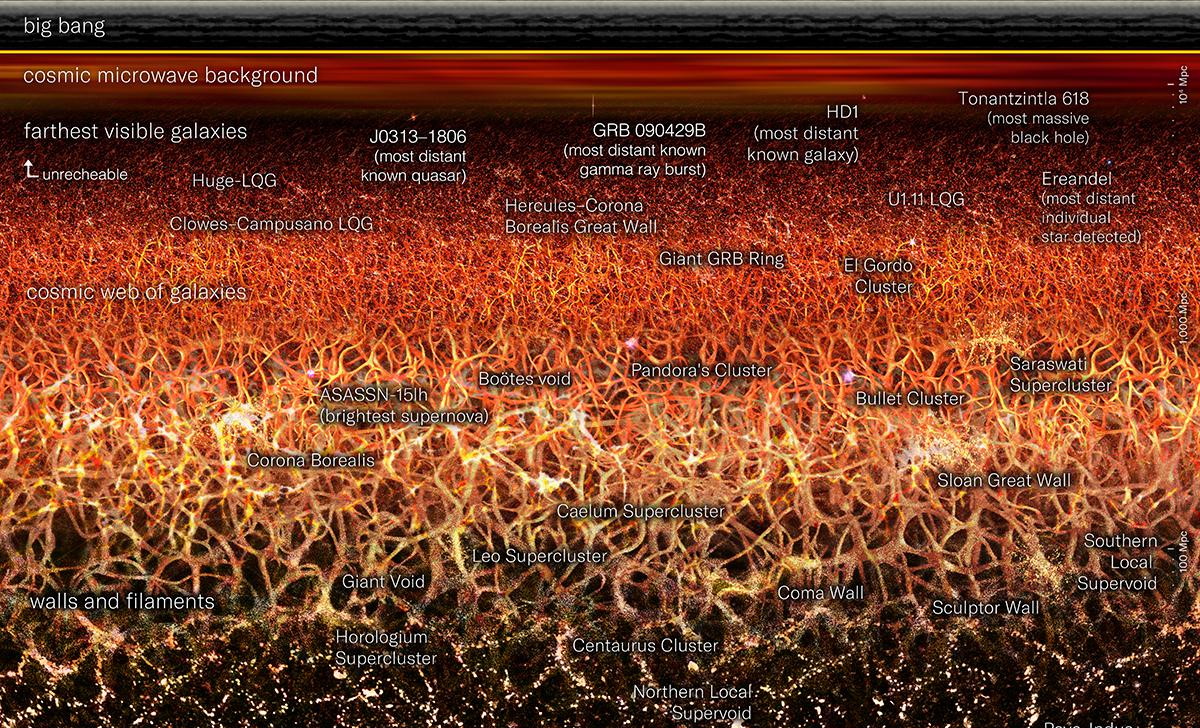
The largest features seen here, like “great walls” and “large quasar groups” may not be cosmologically bound structures, but rather apparent pseudostructures, where gravitation due to their cumulative masses will be insufficient to keep them bound. Dark energy, on the largest cosmic scales, will drive all things apart.
At the cosmic limits, the edges of time are revealed: the earliest moments after the hot Big Bang.
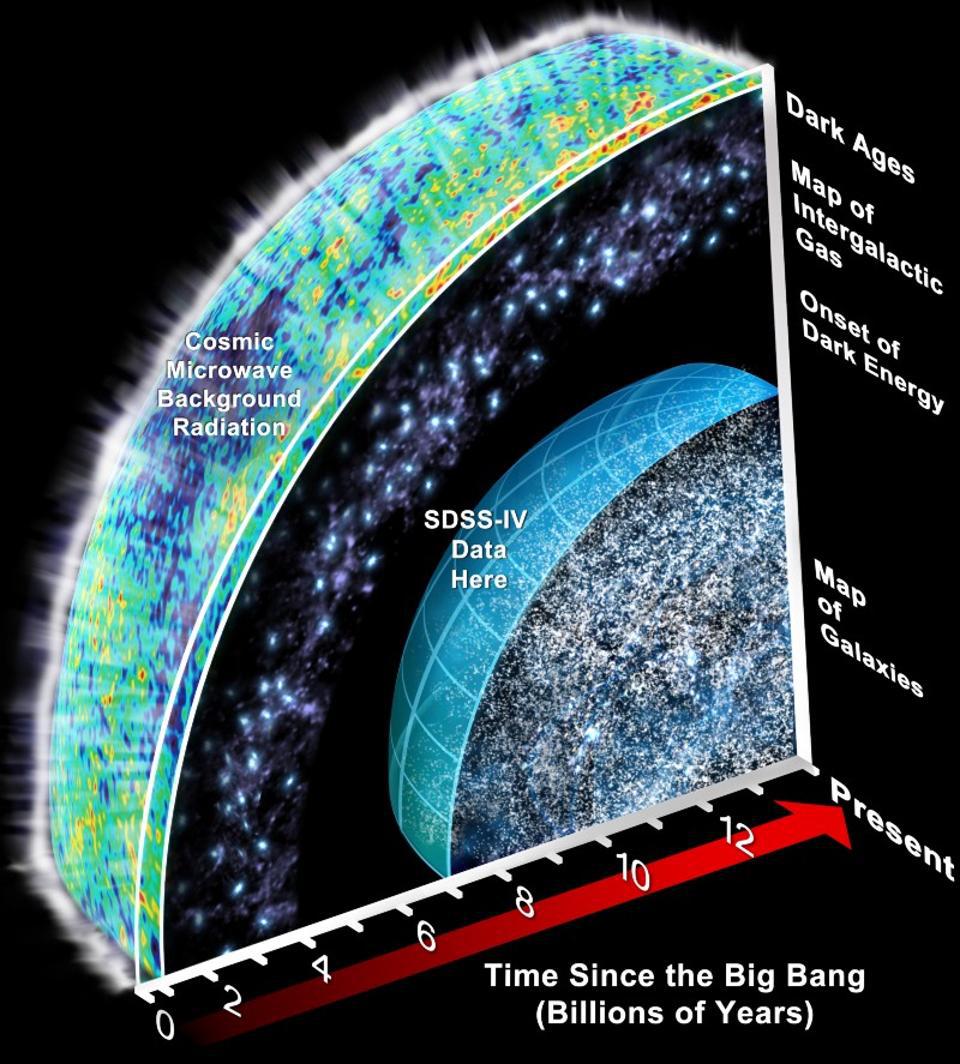
From objects within our Solar System to stars within our galaxy to distant galaxies as far as our telescopes can see, space is populated with objects at a specific location in space that emit light. We can only observe the light that is arriving right now: after journeying through the expanding Universe. However, the leftover light from the Big Bang, the CMB, was emitted from all locations at a specific moment in time. With each passing moment, light from a slightly more distant location than the previous moment arrives.
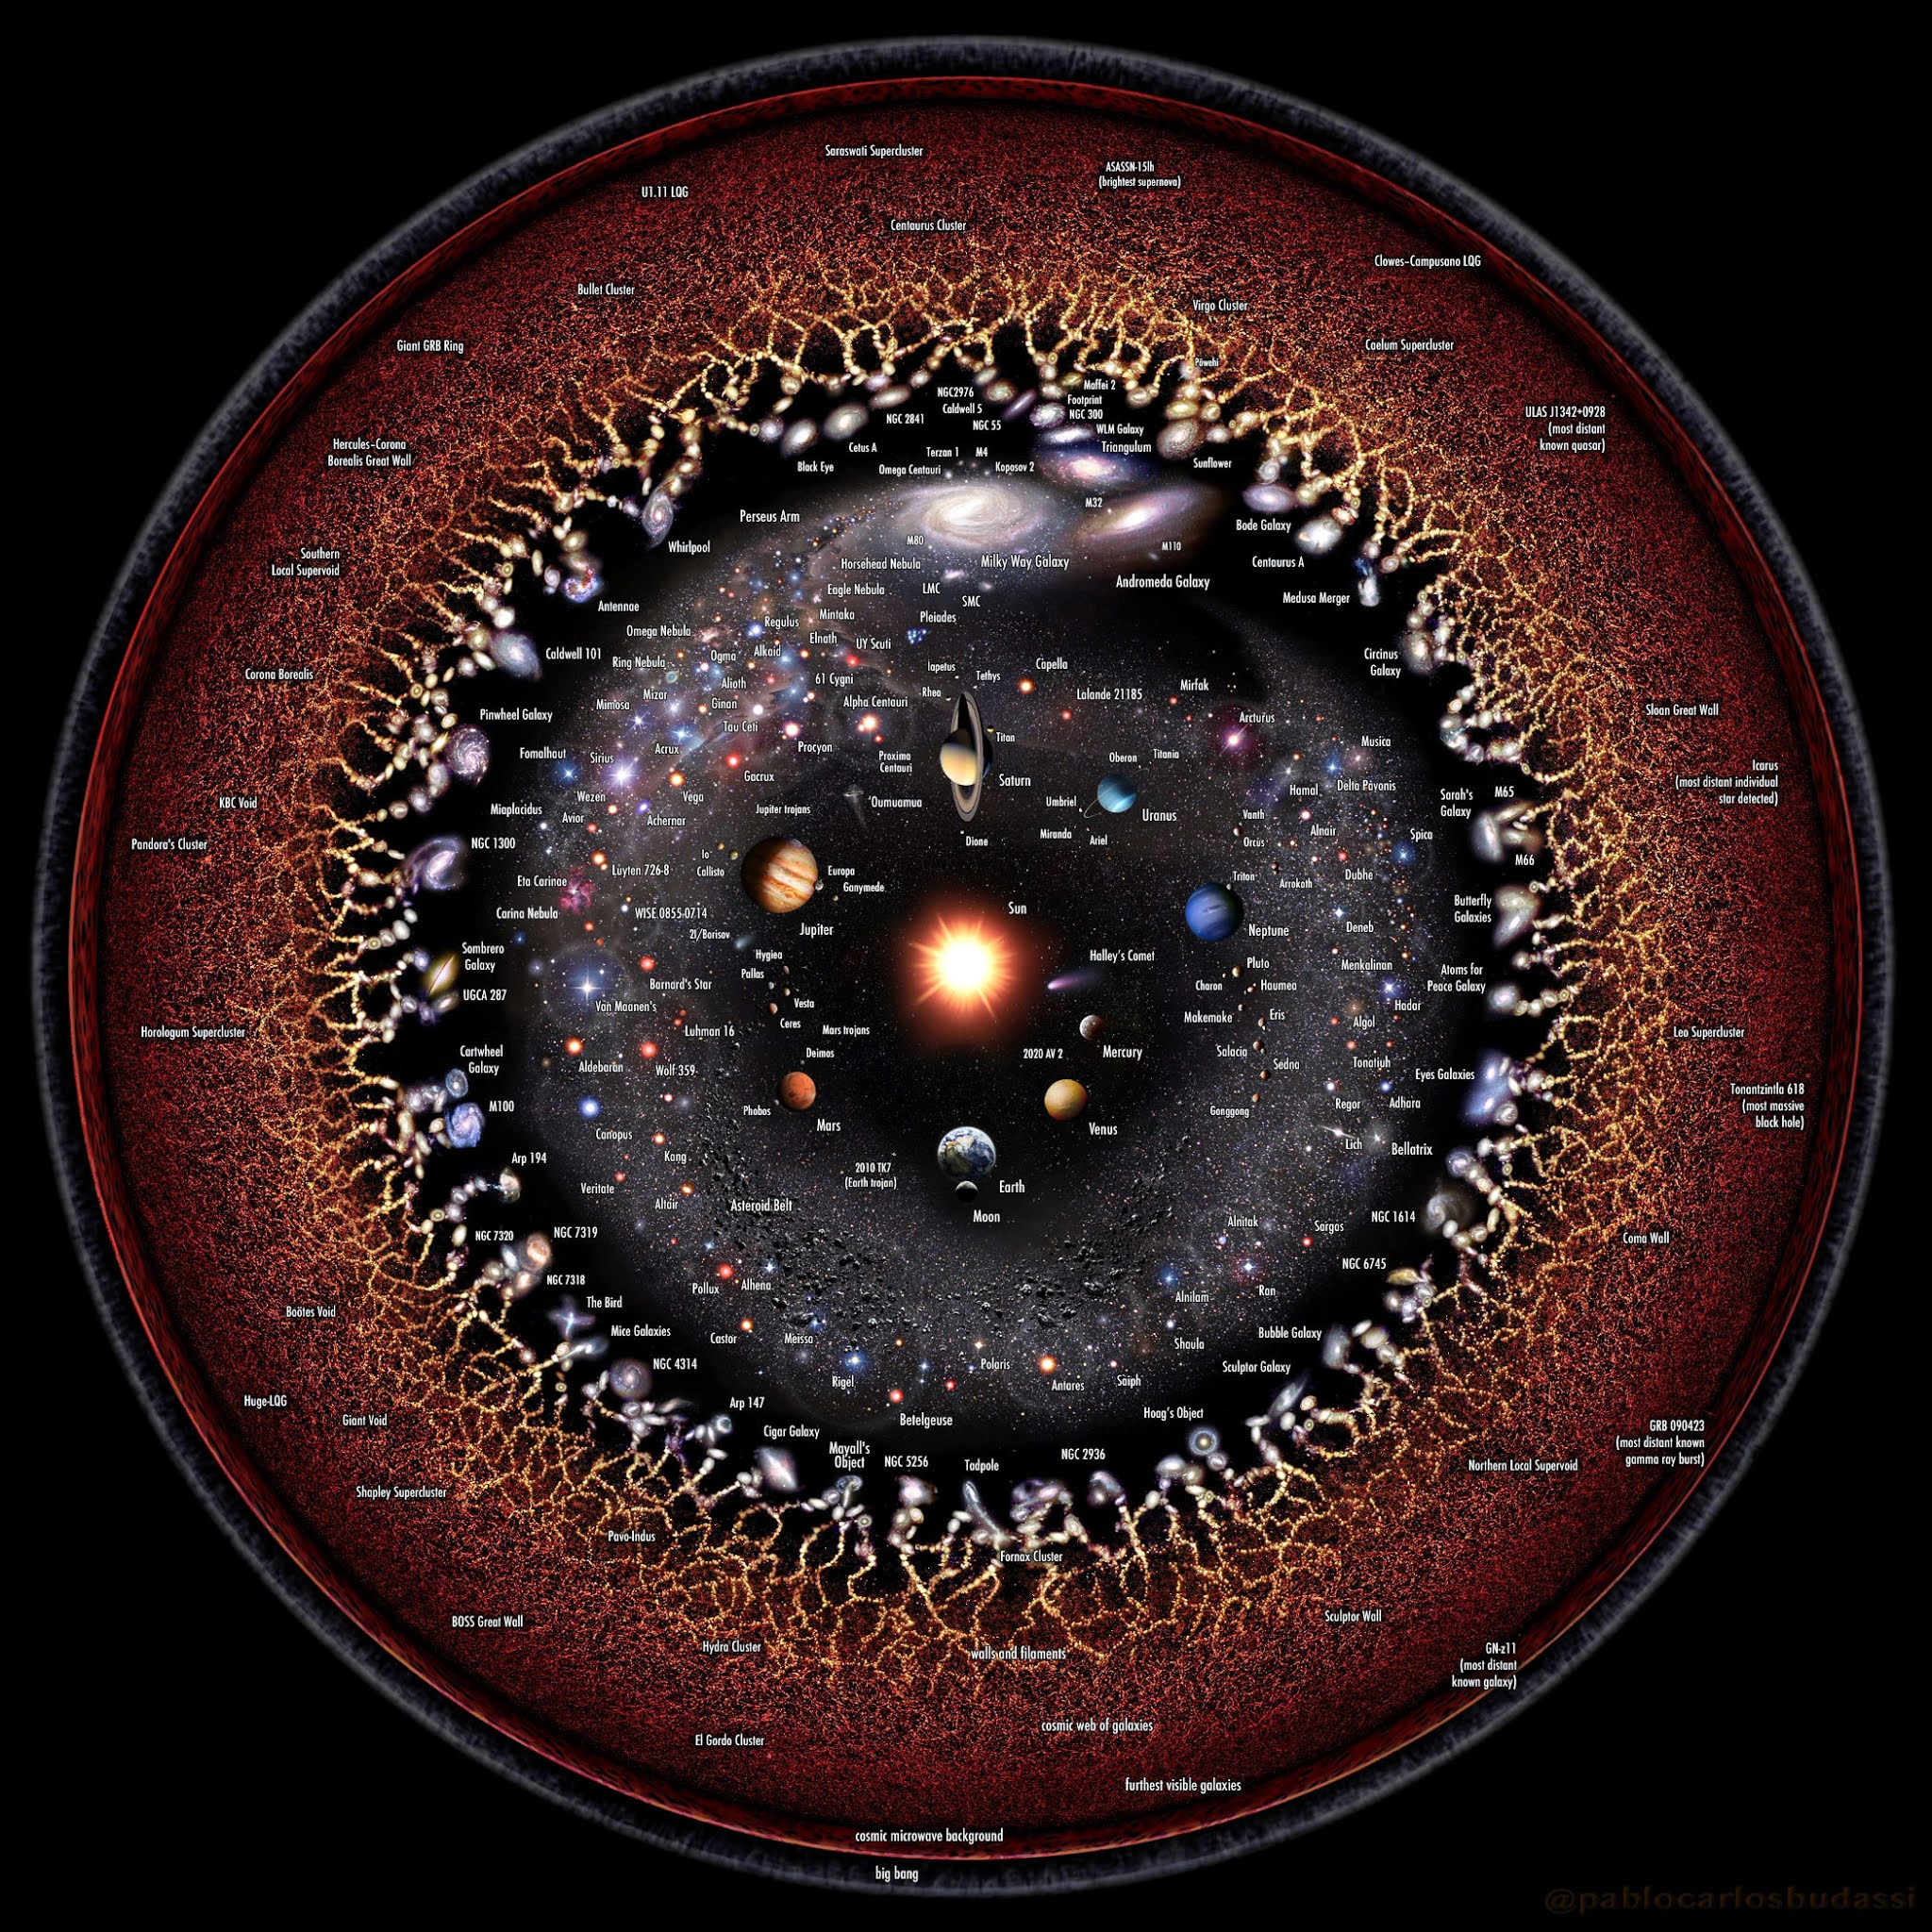
Thanks to artist Pablo Carlos Budassi for creating this brilliantly illustrated cosmic journey.
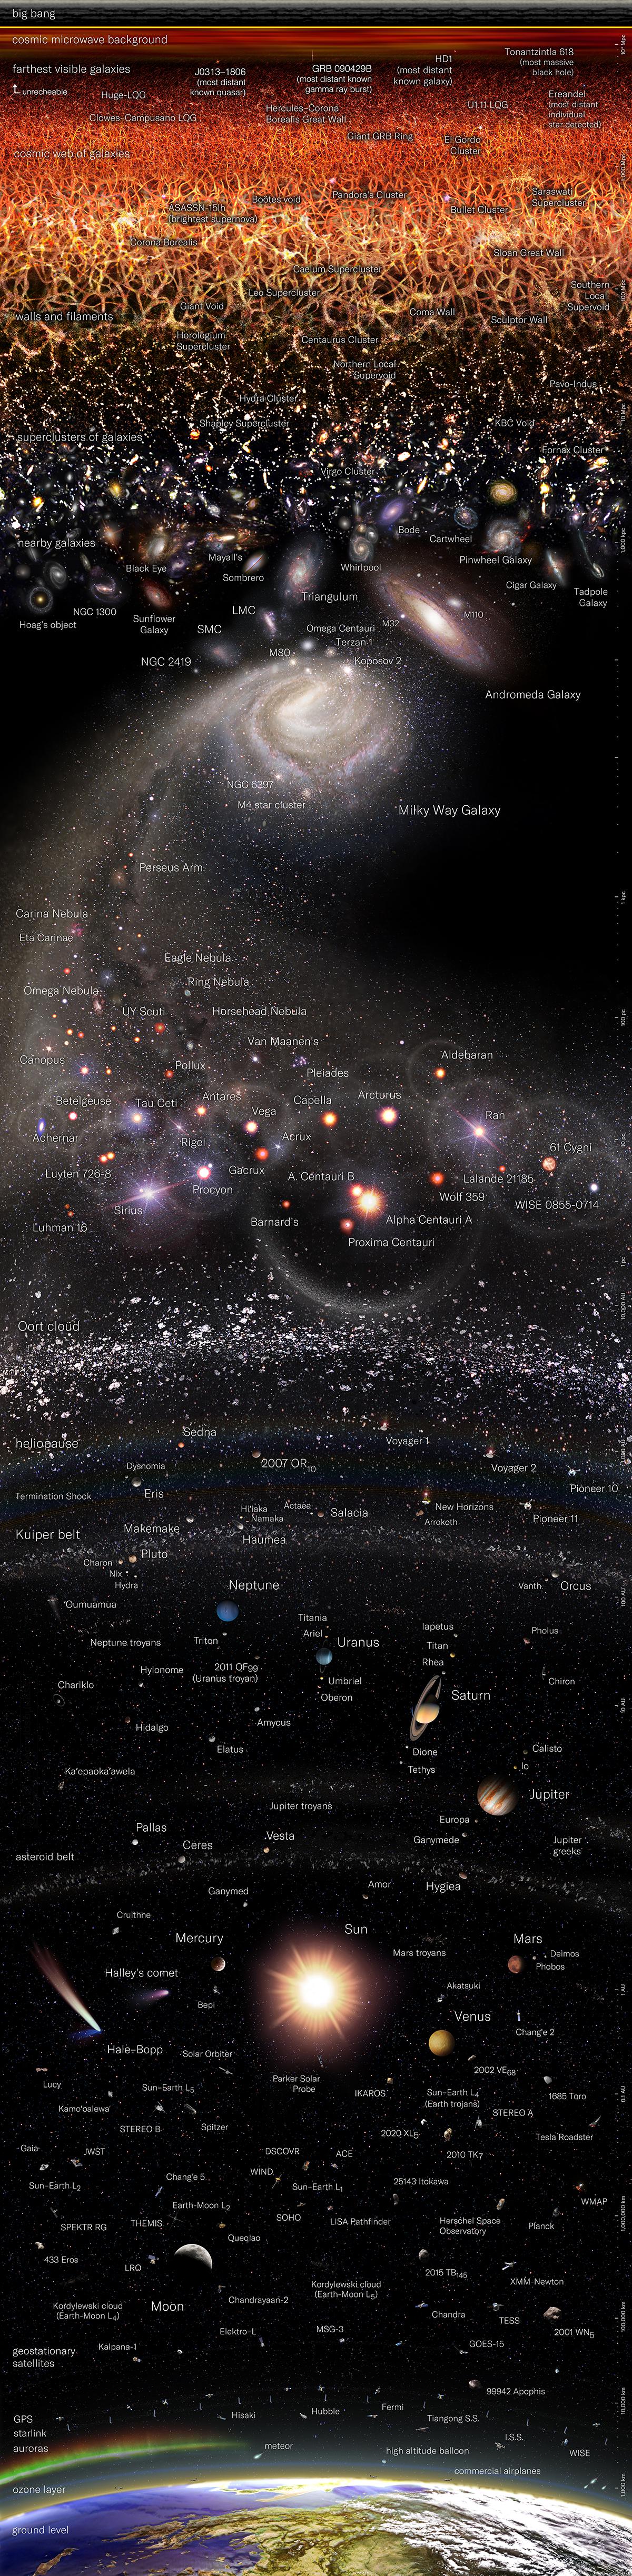
This vertically oriented logarithmic map of the Universe spans nearly 20 orders of magnitude, taking us from planet Earth to the edge of the visible Universe. Each large “mark” on the right side’s scale bar corresponds to an increase in distance scales by a factor of 10.
Mostly Mute Monday tells an astronomical story in images, visuals, and no more than 200 words. This article was first published August of 2022. It was updated in September of 2025.
This article See the whole Universe at once in this unique logarithmic view is featured on Big Think.


Learn more about Jane Street internships at https://jane-st.co/internship25-SM
Everyone says the maximum height for a drinking straw is 10.33m, but it's not. I found out by making the tallest possible siphon.
Veritasium straw video: https://www.youtube.com/watch?v=HUmZrtiXDik
Periodic videos siphon in a vacuum: https://www.youtube.com/watch?v=8F4i9M3y0ew
Veritasium trees video: https://www.youtube.com/watch?v=BickMFHAZR0
You can buy my books here:
https://stevemould.com/books
You can support me on Patreon and get access to the exclusive Discord:
https://www.patreon.com/stevemould
Twitter: http://twitter.com/moulds
Instagram: https://www.instagram.com/stevemouldscience/
Facebook: https://www.facebook.com/stevemouldscience/
TikTok: https://www.tiktok.com/stevemould
Buy nerdy maths things: http://mathsgear.co.uk

It is my increasingly firm belief that computers are tools that strip us of our humanity, converting our behaviour and thoughts into data that can be captured and commodified by other machines and their owners. They are not “just tools” – how can they be when we consider who made them and for what purposes, and how they continue to be used in our social and work lives?
The computer. The Internet. Artificial intelligence. These are military technologies, first and foremost. First and foremost and for a while now. And while certainly we must resist the teleology that positions these technologies always and forever thus, we have accomplished little, I'd argue, in wresting them free from their origins in “command control communication intelligence,” from that cybernetic move to reduce everyone and everything to code.
Many of us work in jobs that involve using computers and we are no doubt dealing with lots of data. We also have mortgages to pay and children to put through marketised education systems that have shifted the cost from the state to individuals. Living is an expensive, precarious undertaking. We have little to no freedom in forming the shape of our jobs, and the use of analytics – a term rooted in the military, surveillance and finance – in some form or other.
If you work in digital marketing, you’ll deal in depersonalising, martial and downright hostile language every day. We undertake campaigns, formulate a strategy and tactics, track website visitors – often without them knowing – and convert prospects. Data is a key weapon in this war.
How useful this activity is for anyone apart from Google is the subject of a different article. But consider whether you want – let alone need – to be doing this to your readers on your personal website.
When I started this blog – 17 years ago! – I installed WordPress’s analytics plugin, which told me how many people were visiting, what they looked at and who was linking to me. I didn’t ask whether I could track this information, and no-one volunteered it. Regardless of whether it was anonymised (yet another grisly marketing term), I was surveilling my readers.

I ditched analytics quite early in this blog’s history when I realised that knowing about my website visitors had zero effect on anything in the real world. For example, when Smashing Magazine linked to a WordPress theme I’d published I got thousands of visitors over a couple of days. The only practical outcome was that a couple of people approached me to redesign their websites. This would have happened regardless of whether I knew that I’d been linked to, and how many clicks this link had generated.
The other reason you might put analytics on your site is to know when someone links to your writing. Again, if the linker doesn’t intend to tell you, then you’re surveilling. You do not need to know every time your writing is mentioned.
If you link to someone else and you’d like them to know, there are ways to automate a notification, through webmentions, for example, or you can do the radical thing and actually tell them by sending an email or message on social media.
We should resist the urge to data-fy and commodify our personal websites. Unintuitively, that means smaller, more closed communities and networks where communication is intentional rather than automated and surveilled. You’ll never know everything about your website, or its readers, and nor should you.
Next Page of Stories