It’s unfortunately not uncommon for pedestrians to be killed by cars in the US. More than 7,300 pedestrians were killed in motor vehicle accidents in the US in 2023, around 18% of all motor vehicle deaths that year. Until around 2009, pedestrian deaths in the US had been falling, declining from 7,516 deaths in 1975 to just 4,109 in 2009 (in per capita terms, this decline would be even larger.) But since 2009, pedestrian deaths have surged.
Motor vehicle deaths overall are up, but not nearly to the same degree. From 2009 to 2023, non-pedestrian motor vehicle deaths in the US increased by around 13%, compared to a 78% increase in pedestrian deaths. (The low point in non-pedestrian motor vehicle deaths is actually 2014; deaths are up 20% since then.)
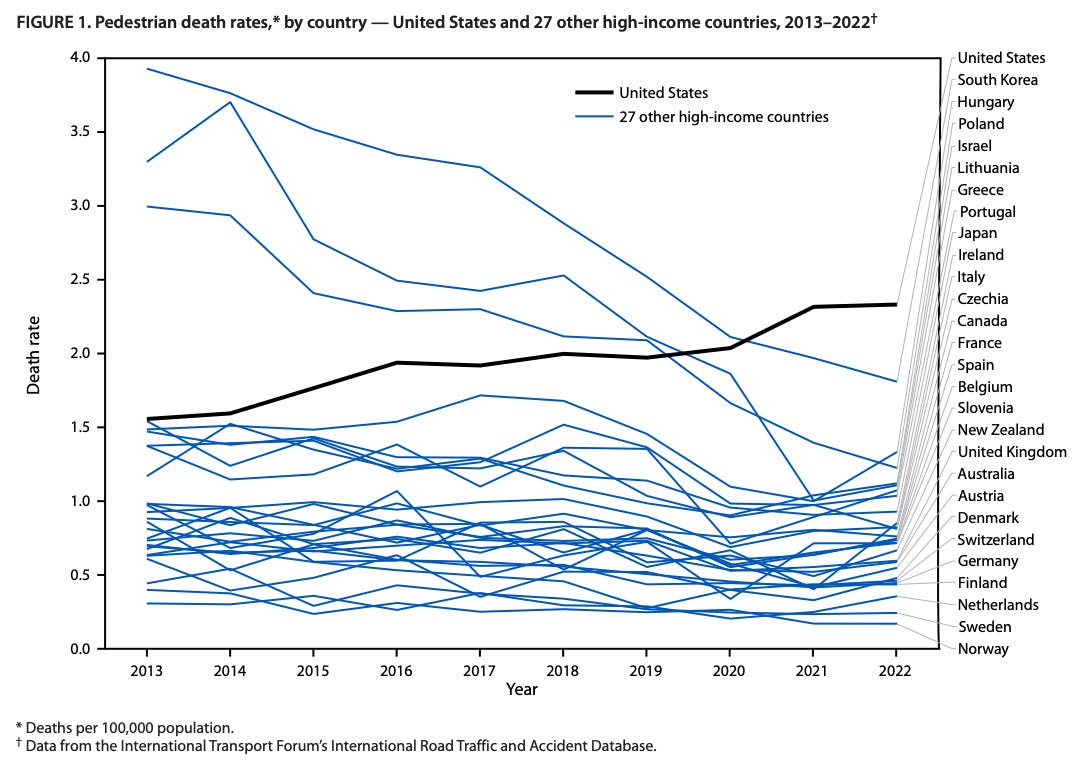
Other countries haven’t seen this increase in pedestrian deaths: in every other high-income country, rates are flat or declining. Whatever’s causing the problem seems to be limited to the US.
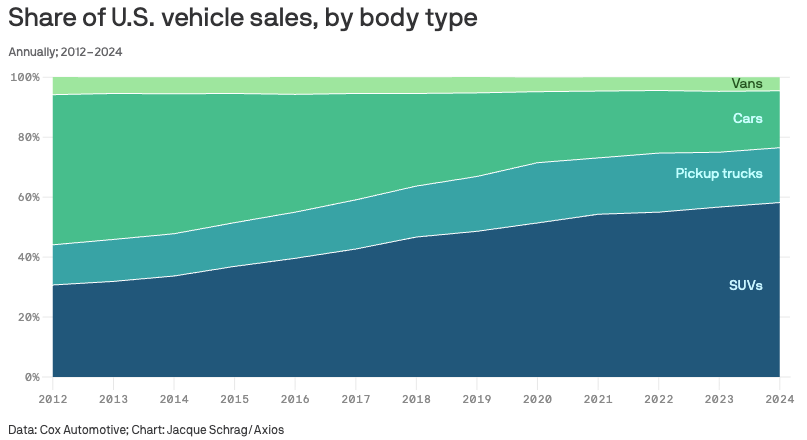
There are a variety of theories for what’s causing this increase in pedestrian deaths. Perhaps the most common theory is that as trucks and SUVs have become both more popular and larger (in height and overall size), pedestrian collisions have become more frequent and more deadly. Another theory (one that’s harder to square with the “US only” nature of the phenomenon) is that drivers are increasingly distracted by smartphones, leading to more accidents. And of course, it could be something else entirely, such as drivers becoming more reckless for some reason.
Looking at the data, the strongest evidence seems to be for the “big SUV” hypothesis: the fatality rate for pedestrian accidents has increased dramatically across a variety of states, pointing to “pedestrian accidents becoming more deadly” as a major cause of the increase. But the case for it isn’t open and shut, as pedestrian deaths involving sedans and compacts have also increased. And while there isn’t much evidence for the “distracted by phones” hypothesis, it’s also hard to rule it out completely.
Pedestrian deaths in the US
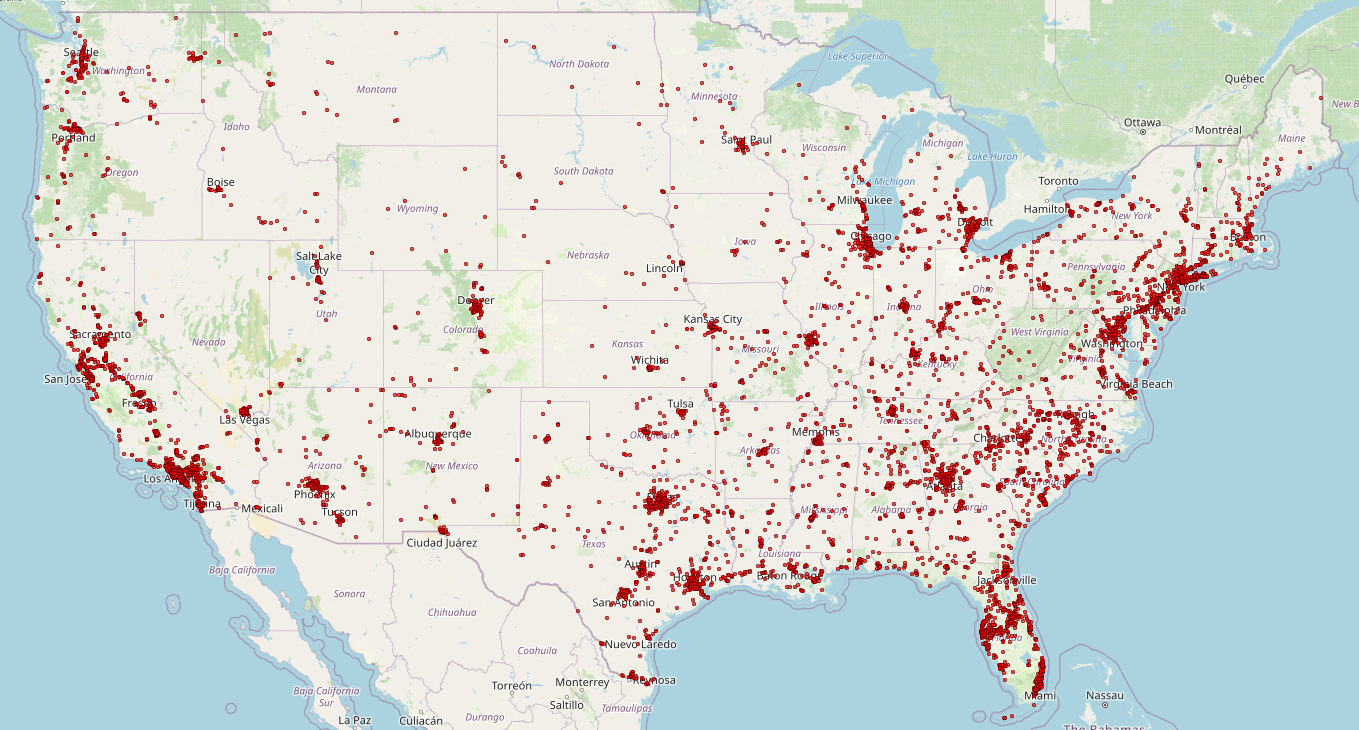
To investigate US pedestrian fatalities, we can use NHTSA Fatality Analysis Reporting System (FARS) data, which collects information on motor vehicle fatalities going back to 1975. FARS data is very thorough (it includes vehicle identification numbers, or VINs, the time of accident down to the minute, and the exact coordinates of the crash), making it possible to investigate a variety of possible explanations for the fatality increase. To start, let’s get a sense of where these pedestrian deaths are happening. The map below shows every pedestrian death in the continental US in 2023: each dot is a pedestrian death.
This is one of those maps that’s also a population map — pedestrian deaths tend to be concentrated in major metro areas, where there’s the most people and the most driving. If we look at pedestrian deaths by state, we see the same pattern, though it’s also clear some states are punching above and below their weight. The three states with the most pedestrian deaths — California, Florida, and Texas — are the three most populous states. But New York, the 4th most populous state, has fewer pedestrian deaths than Georgia, the 8th most populous state.
If we look at pedestrian deaths per capita, we see that deaths are much more frequent in the West and the South, and less frequent in the Northeast and the Midwest. This does not appear to be due to larger amounts of driving in the South and the West. There’s little correlation between the number of vehicle miles traveled and the pedestrian death rate.
These numbers are all from 2023. If we look at the change in pedestrian deaths over time, we can see that the rise in pedestrian deaths is worse in the South, but besides a handful of states (Minnesota, Rhode Island, New York, West Virginia, New Jersey, and Vermont), every state has seen substantial increases in pedestrian deaths. Whatever’s causing the increase in US pedestrian deaths is happening across the country.
We’ve seen that pedestrian deaths are more likely to occur in population centers, but FARS data also lets us look at the type of road where deaths occur:
The increase in fatalities is essentially entirely on urban roads — deaths on rural roads are flat. On most categories of urban road, pedestrian fatalities have doubled. Whatever is causing the increase in pedestrian deaths, it’s only happening in urban areas.
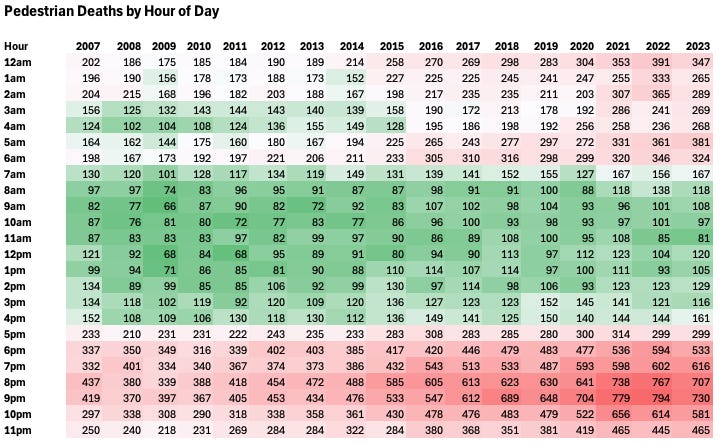
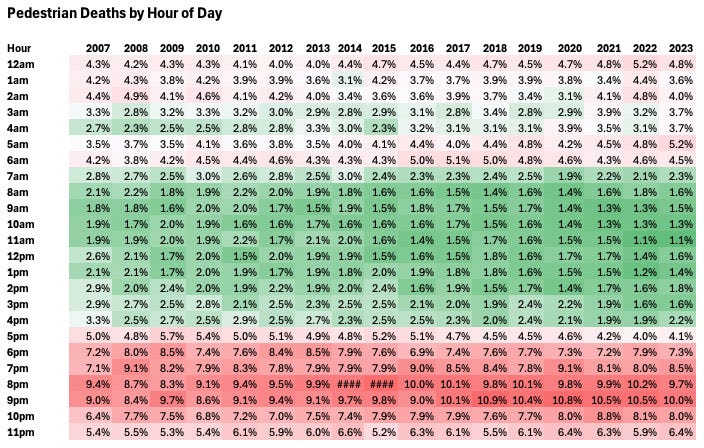
We can also look at other trends in pedestrian deaths for clues as to why they might be increasing. Here are pedestrian deaths by the hour the accident occurred, from 2007 to 2023:
And here’s the same chart in percentages:
Most pedestrian deaths occur at night, but the rate hasn’t changed much (the fraction of deaths between 6pm and 6am is up slightly from 69% in 2009 to 75% in 2023). Whatever’s causing the increase in pedestrian deaths doesn’t seem specific to one time of day.
Nor is it specific to one time of week. Deaths have become somewhat less likely to occur on Friday and Saturday, and somewhat more likely to occur during the week, but the shift isn’t dramatic.
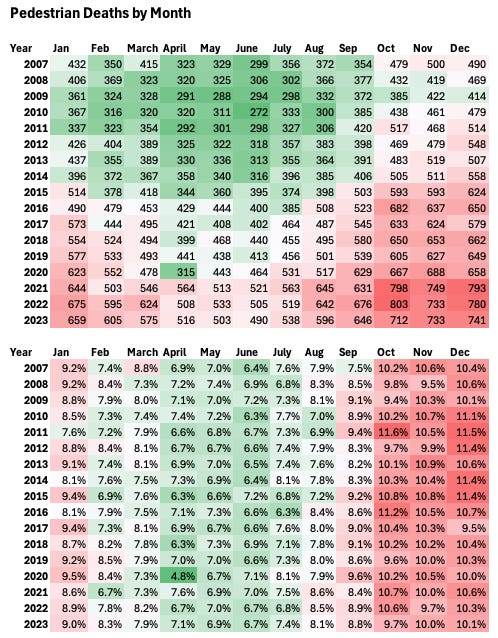
It’s also not specific to one time of year. The graph below shows pedestrian fatality frequency by month. Pedestrian deaths are more likely to occur in the fall and winter (presumably because there are fewer daylight hours and more driving in darkness), but monthly rates haven’t changed at all.
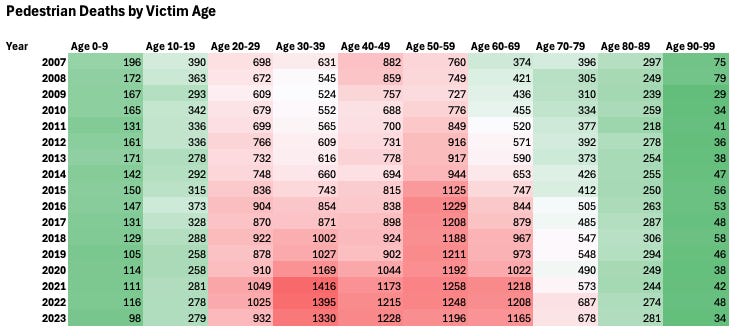
What about trends in the age of pedestrians killed? You sometimes see claims that children are increasingly at risk of getting killed by large trucks and SUVs, because they can’t be seen by the drivers. The graph below shows pedestrian deaths broken down into 10-year age buckets.
Deaths of children under 10 are actually down significantly (167 deaths in 2009 to 98 deaths in 2023), and deaths for ages 10-19 are down as well. The biggest increase in deaths actually comes from older age brackets: 30-39 year old deaths are up 153%, 60-69 year olds up 167%, and 70-79 year olds up 119%. So the problem isn’t young kids increasingly getting hit by cars that can’t see them.
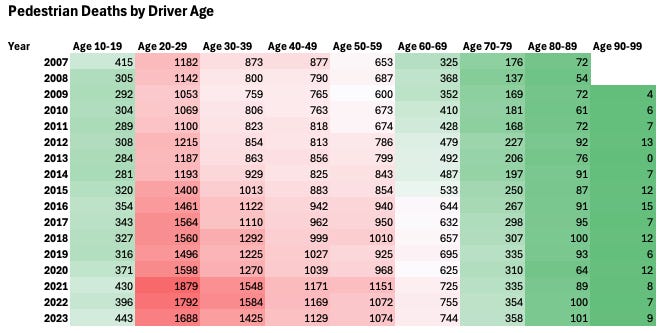
What about the age of drivers?
Deaths are up in every driver age bracket, with older brackets (30-39, 60-69 and 70-79) up the most in percentage terms. So the problem isn’t reckless young drivers.
What about trends in drug and alcohol use? According to FARS data, deaths that involved drivers drinking are up modestly, but are a very small fraction of overall pedestrian deaths. The increase in driver drug use is up by a much greater fraction (more than doubling since 2009), but it’s still a small percentage of pedestrian deaths.
Interestingly, driver drug and alcohol use in pedestrian fatalities is greatly exceeded by pedestrian alcohol and drug use. (Pedestrian drug use in particular has more than tripled since 2009, while alcohol use is only up modestly.) It’s not enough to explain all of the huge increase in pedestrian deaths, but it’s notable.
An obvious possible factor in increased deaths is people increasingly distracted by their phones. Unfortunately, FARS data doesn’t give us much to go on here. Since 2010 FARS has tracked whether drivers are distracted (by phones or anything else), but in the vast majority (94%) of cases, drivers are marked “not distracted,” “not reported,” or “unknown.”
Relatedly, in the majority of pedestrian deaths, the pedestrian is blamed for the accident. In 66% of cases, pedestrians are described as “failing to yield right of way,” “jaywalking,” or “in roadway improperly.” In 87% of cases, the driver is not charged with anything following the accident. (This doesn’t necessarily mean the pedestrian was at fault — it could simply indicate that in a pedestrian death we only get one side of the story, which makes it hard to charge the driver with a crime.) About 75% of the time, fatal pedestrian accidents occur outside an intersection (a rate which has been steady since 2010), suggesting pedestrians are most often struck outside of a crosswalk.
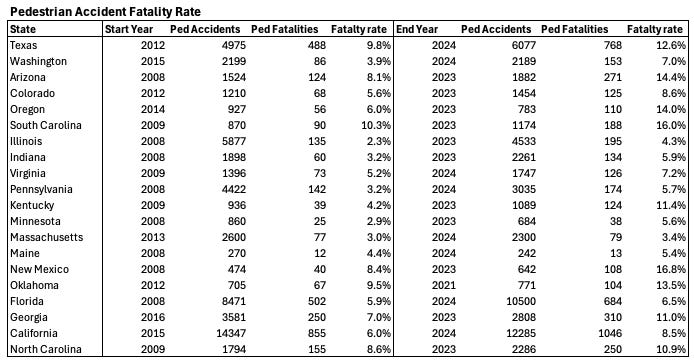
One limitation of the FARS data is that it only tracks pedestrian fatalities: it doesn’t give us any information or trends in non-fatal pedestrian accidents. Many states, however, do track this information. The chart below shows the total number of accidents involving a pedestrian, and the number of pedestrian fatalities, for different years for 20 different states.
In nearly every state examined, the fatality rate for pedestrian accidents has risen dramatically in recent years. Oregon went from deaths in 6% of accidents in 2014 to 14% of accidents in 2023. Illinois went from 2.3% of pedestrian accidents being deadly in 2008 to 4.3% in 203. New Mexico went from 8.4% in 2008 to 16.8% in 2023. In many cases, overall pedestrian accidents were flat or even down (Illinois went from 5,877 accidents in 2008 to 4,533 accidents in 2023), even as the number of pedestrian fatalities went up.
Pedestrian accidents getting more deadly seems like fairly strong evidence for the theory that the rise in large SUVs is behind the uptick in pedestrian deaths: it’s not that more pedestrians are getting hit by vehicles, it’s that the ones that are getting hit are more likely to die. There’s other evidence that points to this theory. A study by the Insurance Institute for Highway Safety analyzed 17,897 pedestrian accidents across seven states, and found pedestrians were substantially more likely to be killed when struck by tall vehicles and vehicles with blunt front ends.
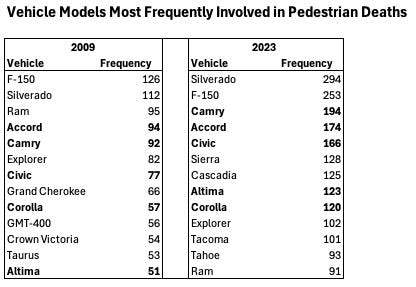
However, there’s also some muddying evidence here. If the increase of size and frequency of trucks and SUVs was behind the increase in pedestrian deaths, we wouldn’t expect to see an increase in the frequency of pedestrians killed by sedans or compact cars. However, if we look at pedestrian deaths by model of car, we see that pedestrian deaths involving popular sedans have increased as well. Pedestrian deaths involving Honda Civics and Accords, Toyota Corollas and Camrys, and Nissan Altimas have all increased substantially.
This does not seem to be because these cars suddenly got more popular. Sales volume since the early 2000s is relatively flat or declining:
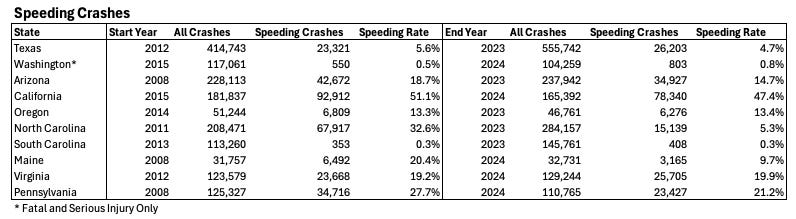
One possible explanation is that pedestrian accidents are more deadly because cars are speeding more frequently, but it’s hard to find evidence of this. The proportion of vehicles speeding in both pedestrian fatalities and fatalities in car accidents overall is flat.
On the state level, different states have dramatically different speeding rates (presumably due to classification differences), but overall rates of speeding collisions seem to be mostly flat or declining.
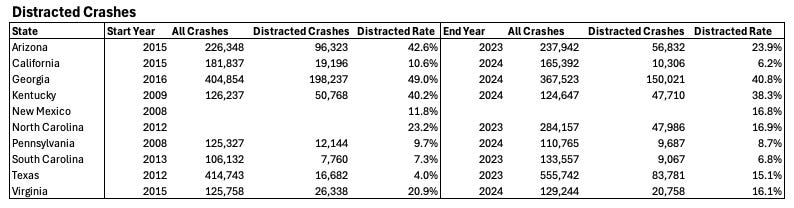
We can also use state-level data to look at the “distracted by phones” theory: some states break out whether “distraction” or “driver inattention” is a factor in an accident. The chart below shows the percentage of all accidents where driver inattention (due to phones or anything else) was a listed factor. If being distracted by phones was a major driver of increased pedestrian fatalities, I’d expect it to also be increasingly a factor in car accidents more broadly.
There’s no real clear trend. In some states (such as Texas) the frequency of driver inattention as a factor has increased dramatically over time. But in other states it’s either flat (South Carolina, Kentucky), or has decreased substantially (Arizona, California). This doesn’t necessarily disconfirm the phone theory, as drivers may not be reporting that they were distracted (North Carolina’s annual car crash reports, for instance, note that “Driver Distraction is a self-reporting contributing circumstance. Therefore, the data collected may not reflect the severity of this issue.” But it’s some evidence against it.
Similarly, if being distracted by phones was a driver of pedestrian deaths, I’d expect there to be more frequent collisions overall. But the state-level data similarly doesn’t show any consistent trend. In some states (Texas, South Carolina) collisions are up substantially, though the rate of increase is less than for pedestrian deaths. But in California and Georgia, among others, they’re down.
Conclusion
To recap, here’s what we know about pedestrian deaths.
Pedestrian deaths have risen substantially in the US since 2009, by nearly 80%. This increase is seen across the US, though not in every single state. The increase is highest in states in the West and South. There has not been a similar increase in other types of motor vehicle deaths, or in pedestrian deaths in other countries.
The increase has happened almost entirely on urban roads: pedestrian deaths on rural roads have remained roughly constant.
There has not been much change in what time of day, day of week, or time of year pedestrian deaths are occurring.
The 30-39 and 60-79 age brackets have seen the largest increase in victims. Pedestrian deaths of children and teenagers are down over this period. In terms of drivers, the increase has also been largest in the 30-39 and 60-79 age brackets.
It’s hard to pin the increase to any specific driver behavior on the road (including mobile phone use). Drivers are rarely charged with a motor vehicle violation following a pedestrian death, and are rarely categorized as “distracted” (by a phone or anything else). State-level data on frequency of driver inattention shows no consistent trends. Rates of driver drinking are only up modestly; rates of driver drug use have risen greatly in percentage terms, but remain a very small fraction of overall pedestrian death accidents. There doesn’t seem to be a clear trend in rates of collisions overall. Drivers don’t seem to be speeding more.
In terms of pedestrian behavior, the number of killed pedestrians believed to be using drugs has risen substantially over the period in question, but is still a small fraction of overall pedestrian deaths. Rates of alcohol use by pedestrians have increased modestly. In roughly 2/3rds of pedestrian deaths, the pedestrian is described as “failing to properly yield,” “jaywalking,” or as otherwise improperly in the roadway.
In terms of changes in the nature of vehicles, the fatality rate of pedestrian accidents (the proportion of accidents where a pedestrian is killed) has increased dramatically across many different states, suggesting pedestrian accidents are getting more deadly. The frequency of pedestrian deaths in both trucks/SUVs and sedans/compacts has risen substantially.
Unfortunately, this doesn’t all add up to a clear cause. The strongest evidence seems to be for the “Big SUV hypothesis” — it’s hard to see what else could be causing the increase in deadliness of pedestrian accidents, and not cause a similar increase in other things. The Big SUV hypothesis also seems like something that could be limited to the US. But this on its own isn’t completely satisfying: if its big SUVs, why are pedestrian deaths for sedans increasing too? Why aren’t deaths increasing on rural roads? There are still unanswered questions here.
The evidence does not strongly support the “distracted drivers on cell phones” hypothesis, but neither does it totally disconfirm it. The fact that drivers are rarely charged with anything, and are rarely classified as having been driving distracted, could simply be due to the fact that we rarely get more than the driver’s side of the story in pedestrian fatalities. The fact that there’s not a general trend in more auto collisions, or more pedestrian non-fatal collisions, does push against this theory though.
Beyond these hypotheses, there’s also some evidence that increased drug use (both in drivers and pedestrians) is a factor in increased deaths, though almost certainly not the main one. We also can’t rule out that increased recklessness or distractedness on the part of pedestrians is playing a role.
One avenue to try and better understand this problem is to look at the level of individual cities, and to try to figure out why places like Boston and Seattle have so few pedestrian deaths compared to other cities.