Log in



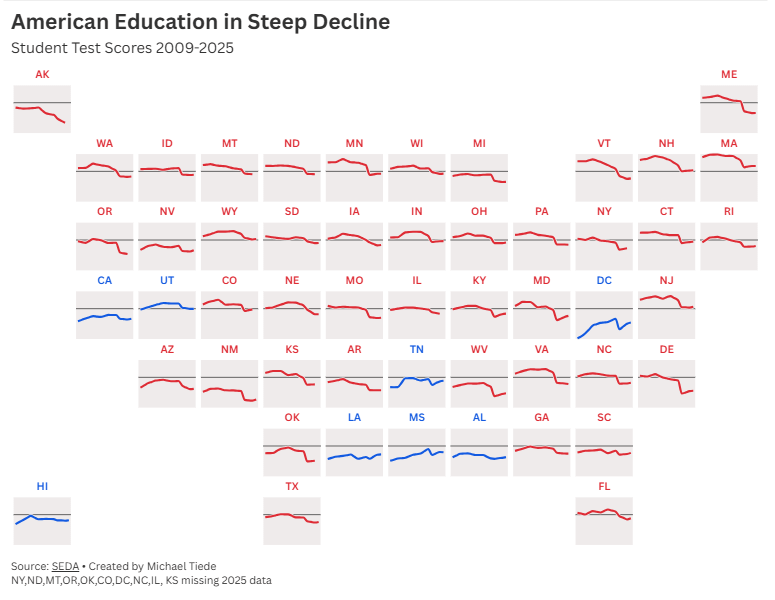
The cracks in American education don’t start in the classroom—they begin at the property line. Math scores have plummeted in a staggering 83% of school districts since 2009 and reading scores are down 70%. Smartphones and pandemic-era lockdowns have contributed to the decline, but well before the iPhone our modern education became trapped inside a geographically segregated housing market. Wealthy families are systematically buying their way into elite, walled-off school districts, leaving middle and lower-income students stranded in underfunded classrooms.
Welcome to The Dividing Line from American Inequality.
These visuals are all interactive and available with more information below.
Education is not considered a ‘fundamental right’ in America
Before the mid-1900s, property tax was mostly a relatively flat tax and public school funding was highly localized, small-scale, and supplemented by various state funds. But after World War II, the GI Bill and massive federal highway investments triggered a suburban boom, fueled by redlining and the systematic exclusion of minority families. Wealthy White homeowners concentrated their growing home equity into self-governing suburbs, creating tax-revenue goldmines for their local schools while hollowing out urban and rural budgets.
By the late 1960s, parents and civil rights lawyers realized that this funding system was wildly unfair. In San Antonio, Texas, parents in the low-income, predominantly Mexican-American Edgewood school district pointed out a stark reality: even though they taxed themselves at a much higher rate than their wealthy neighbors in Alamo Heights, they could only raise $37 per student, while Alamo Heights raised $413 per student.
They sued, arguing that this violated the Equal Protection Clause of the 14th Amendment. The case went all the way to the U.S. Supreme Court as San Antonio Independent School District v. Rodriguez (1973) and in a devastating 5–4 decision (nearly 20 years after Brown v. Board of Education mind you), the Supreme Court ruled against the parents. The Court held that:
Education is not a “fundamental right” explicitly guaranteed by the U.S. Constitution.
Socioeconomic status (being poor) is not a “suspect classification” (unlike race), meaning the government didn’t have to prove a compelling reason for the funding disparities or protection under the 14th Amendment
Local control over schools was a legitimate state interest, even if it resulted in massive funding gaps between rich and poor neighborhoods.
The Rodriguez decision effectively shut the door on using the federal courts to force equal funding across school districts. It institutionalized a zip code trap for education, ensuring that states were legally permitted to let a child’s educational funding be determined by the market value of the houses around them.
State funding closes the gap, until it can’t
Defeated at the federal level, civil rights lawyers pivoted to state courts. In 1990, the dam broke open when a court found that Kentucky’s entire public school system was unconstitutional because it failed to provide an adequate education to poor children. Civil rights lawyers used this “adequacy” strategy in dozens of other states, allowing more state tax dollars to flow into low-income districts, helping to overcome the inadequate funding from local property taxes. NBER data shows this specific influx of cash directly caused a gradual, steady rise in reading and math scores for disadvantaged students throughout the decade.
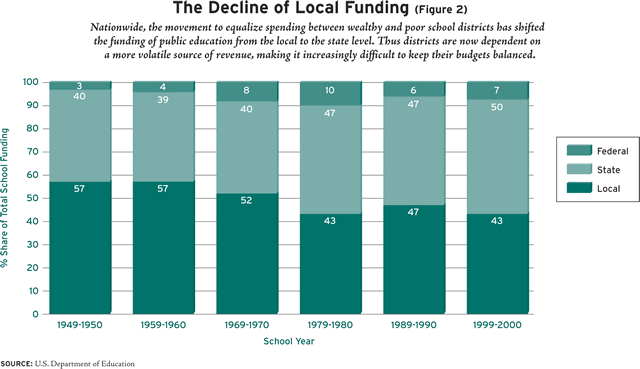
By the early 2000s, state governments were providing the largest single share of public education funding (roughly 49%), while local property taxes had dropped to about 43%.
For over two decades (1990 to 2013), American math and reading scores marched steadily upward. But between 2013 and 2015, that progress abruptly flattened, turned negative, and began a decade-long slide that left eighth-grade students roughly 60% of a school year behind in reading and 40% of a school year behind in math compared to a decade prior.
Researchers point to three major structural shifts during the mid-to-late 2000s and early 2010s that explain this decline:
1. The Financial Aftershocks of the Great Recession (2008)
When the housing market crashed in 2008, local property taxes and state revenues plummeted. Because schools operate on a lag, the deepest cuts to education budgets didn’t hit until roughly 2010 to 2013. School districts across the country executed massive layoffs, increased class sizes, eliminated counselor positions, and cut academic intervention programs. Students in the mid-2010s were learning in severely under-resourced classrooms compared to students in the early 2000s.
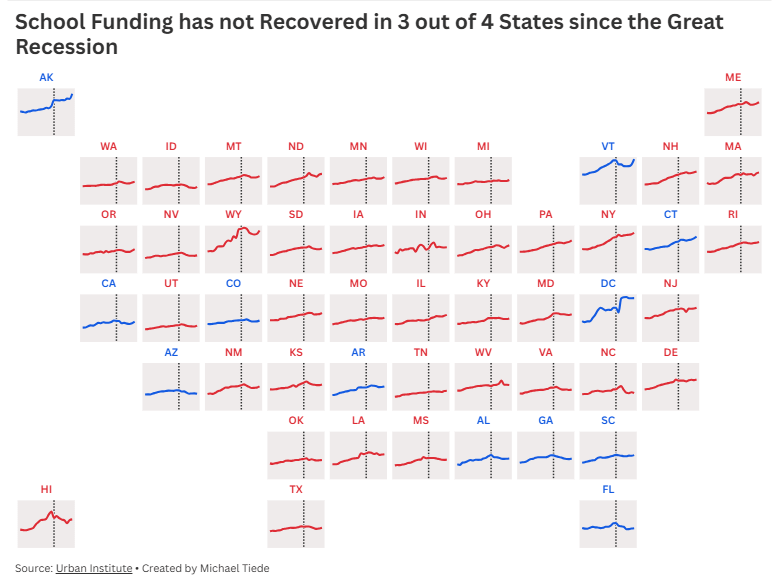
Even though state budgets for education had increased dramatically, when the housing bubble burst state income and sales tax revenues fell off a cliff. Facing massive budget deficits, 31 states slashed their state education aid per student by an average of nearly 10%. By 2014, the share of education funding coming from local property taxes had climbed right back up to its pre-1990s highs.
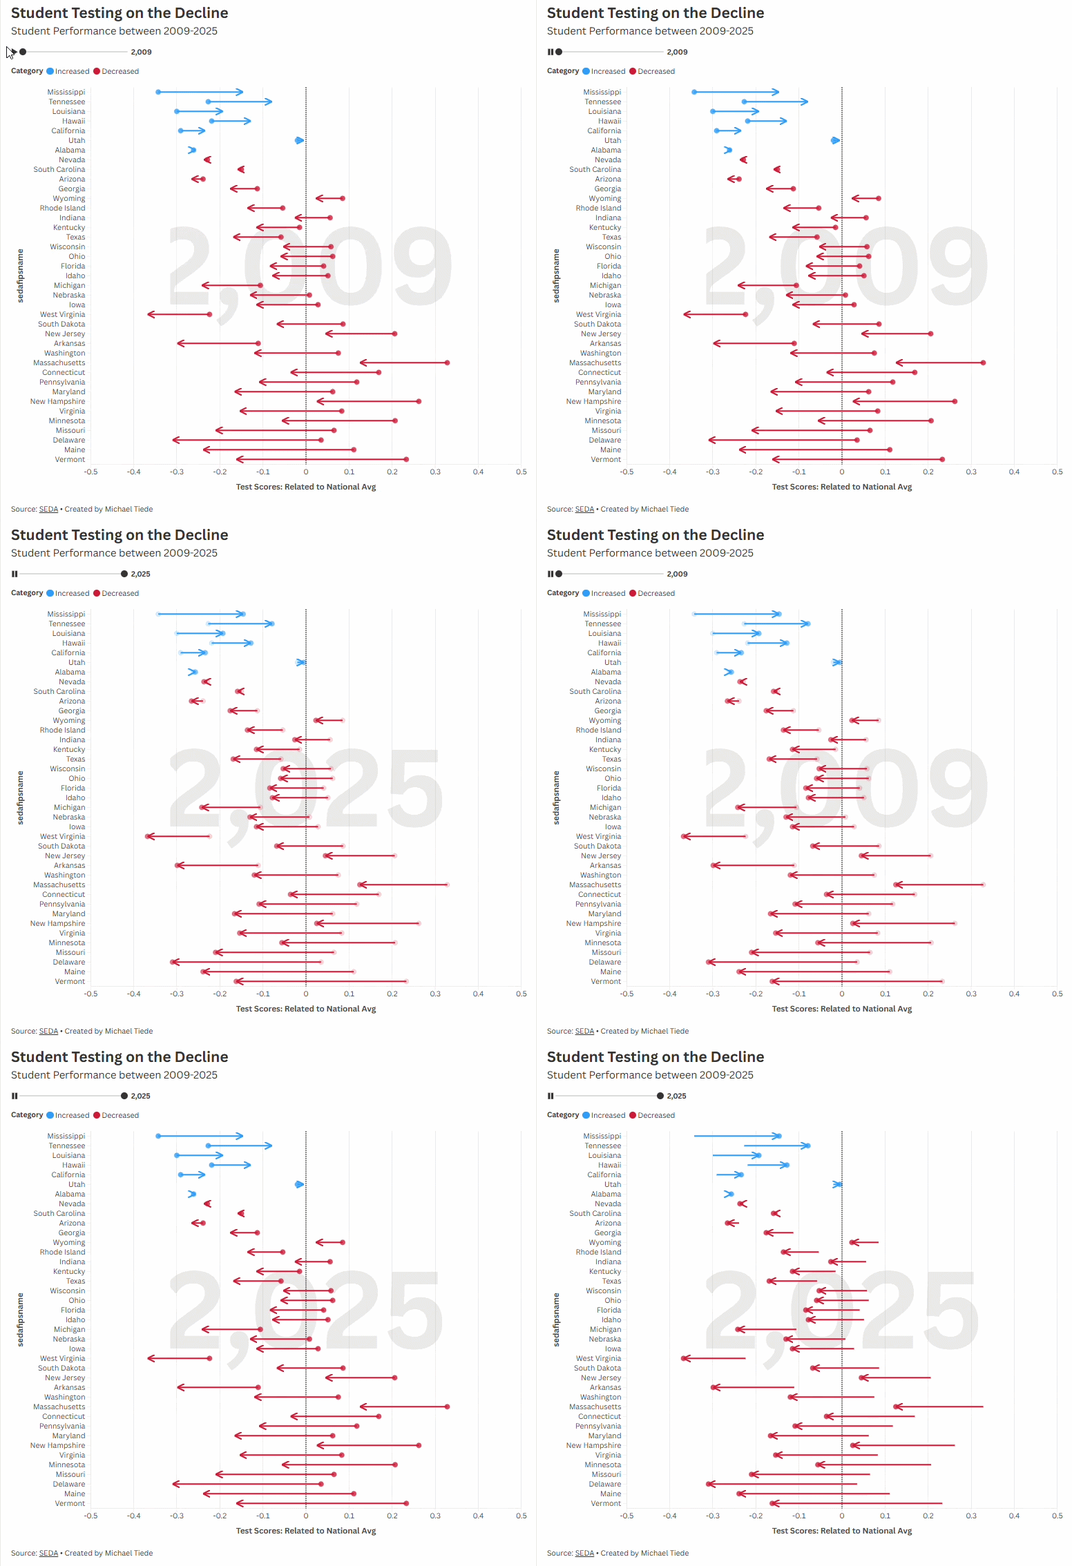
Student performance since 2009 has declined in almost every state, with math scores down in 83% of school districts and math scores down in 70%. Well before phones fully penetrated the life of children and households, math and reading scores really plummeted in large part when the housing market fell away.
2. The Dismantling of Accountability Standards (2015)
During the 1990s and 2000s, federal policies like No Child Left Behind (NCLB) forced school districts to hyper-focus on standardized test scores. While NCLB was heavily criticized for causing teachers to “teach to the test,” the intense federal pressure kept math and reading proficiency scores rising.
In 2015, Congress replaced NCLB with the Every Student Succeeds Act (ESSA), which dramatically scaled back federal penalties and test-based accountability, handing power back to the states. The data shows that the moment this strict, test-based federal pressure evaporated, student performance in core subjects began to drift downward.
3. The Screen Explosion and Social Media Disruption
The collapse of student focus directly correlates with a massive cultural shift in the mid-2010s: the absolute saturation of smartphones, the rise of algorithmic social media (like Instagram and Snapchat), and the school-led push toward 1-to-1 personalized laptops in classrooms.
Higher property values, higher grades
The Educational Opportunity Project at Stanford recently released new data on student testing performance across the US and the results are concerning. Almost every state in the country showed a decrease in testing performance, but poorer communities have been hit much harder.
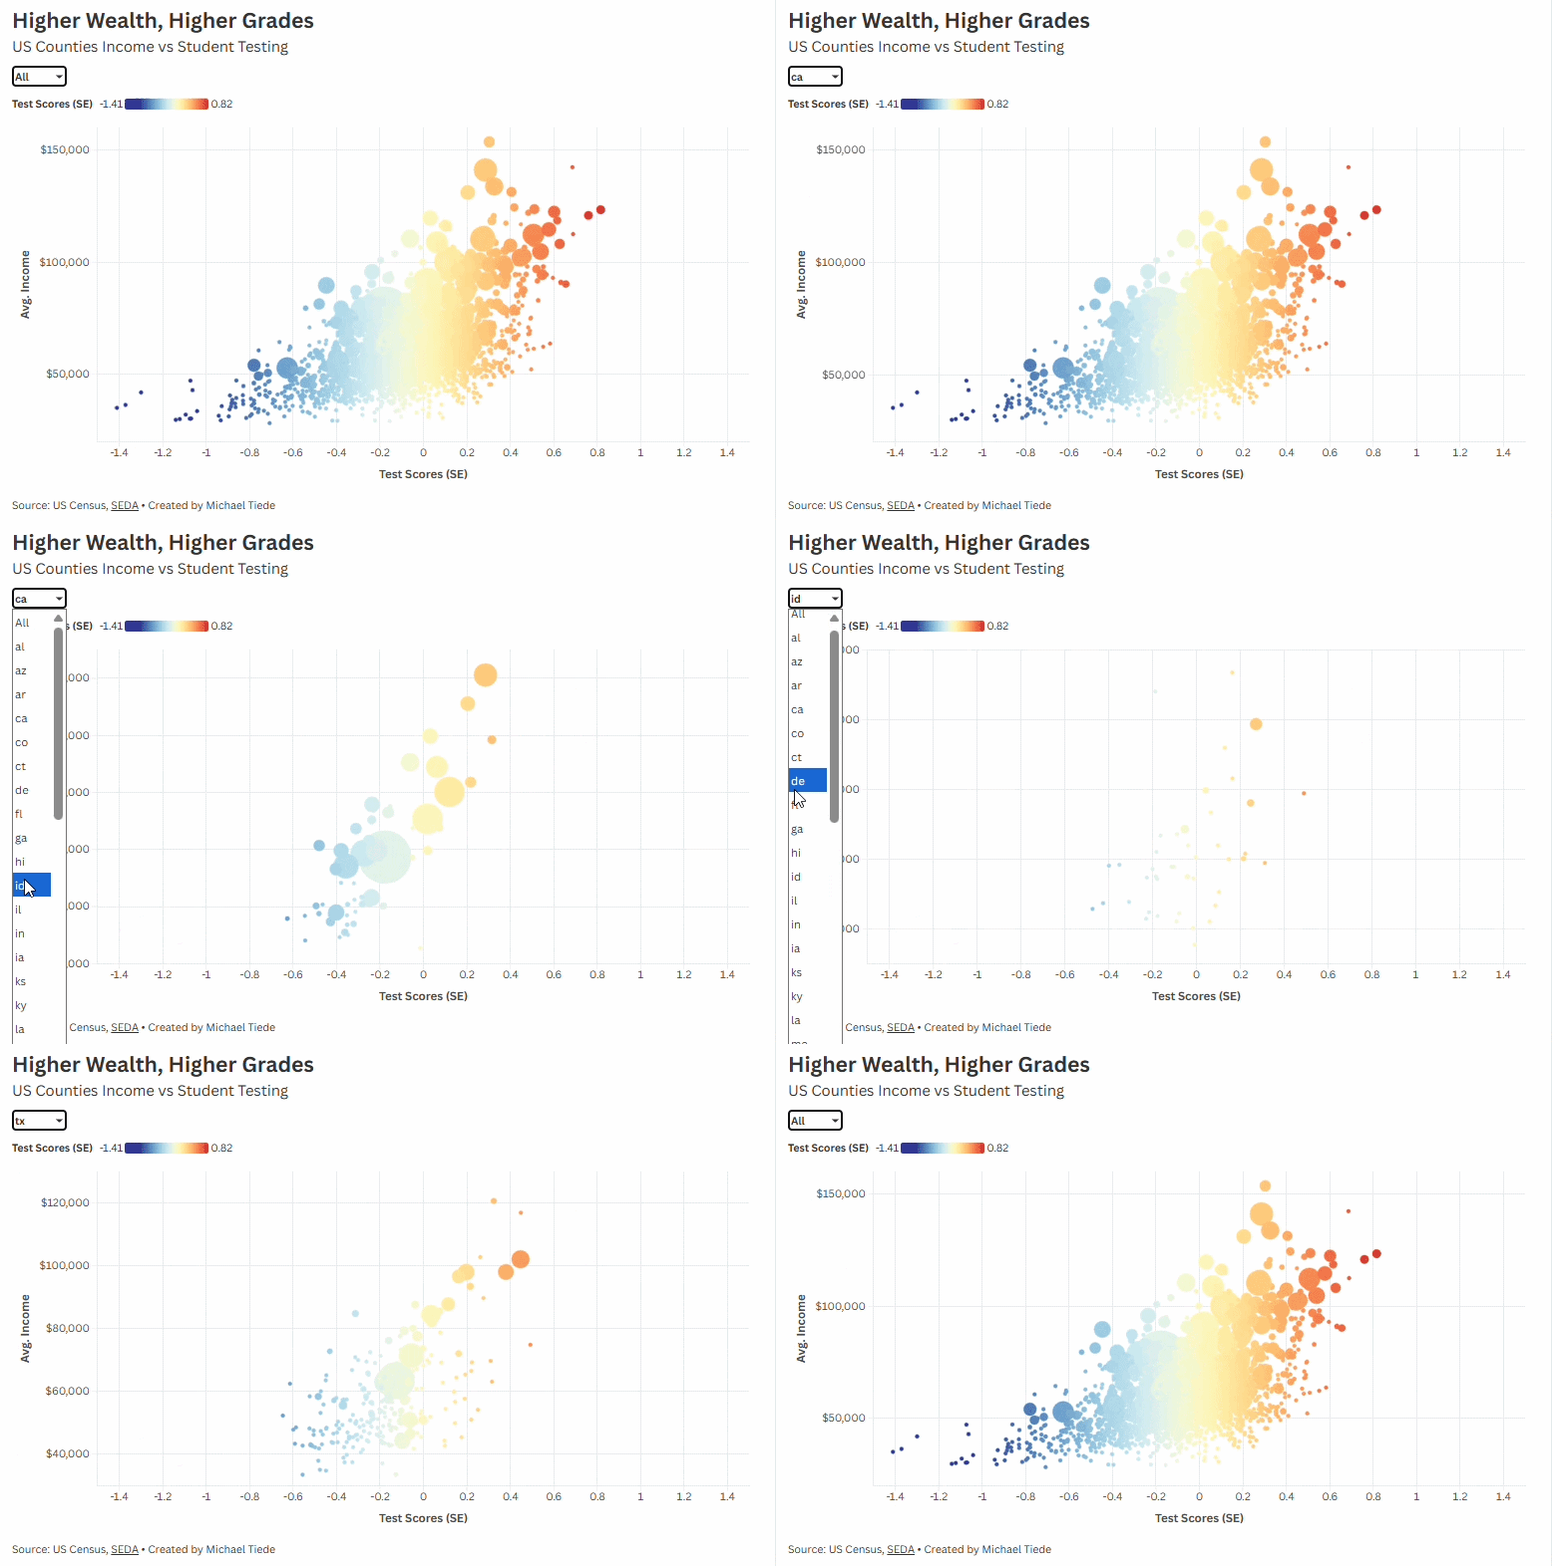
Student performance has declined in almost every state, but local districts reveal a more complex picture. Only 9 states since 2009 have shown an increase in scores, and all improving states are still below the national average. The regions that saw the smallest decline in performance were also the wealthiest regions. The wealthiest districts declined less than middle-class and poorer districts. This highlights a long occurring trend in the American education system that hinders upward mobility and strongly relates income to educational success.
Historically, White families moved from urban neighborhoods into suburban ones, but as minority residents have joined the middle class, the phenomenon of White flight has shifted and segregation continued. Instead, wealthy White families are moving out of more diverse suburban regions into less diverse ones. The demographics of the top 1% of districts are striking. The communities are 72% White, 12% Hispanic and 5% Black. By contrast, the bottom 1% of districts, as measured by school funding, are 51% White, 25% Hispanic, and 15% Black.
Between 2000 and 2010, 150 of the largest metro areas lost at least 20% of their White populations. Areas with strong home values and median incomes show the wealthiest White families leaving as they become more diverse. Over time, these disparities have compounded and the schools with the most funding became havens for majority-White communities. Since 1988, segregation between White and Black students has increased 64 percent in the 100 largest school districts, and 50 percent by economic status since 1991.
The Lower Merion district located in the suburban Philadelphia Main Line boosted its education funding 87%between 2000 and 2015 to more than $23,000 per student. That’s more than double the amount that Philadelphia, one of the poorest cities in America, spent on its students. The school funding gap between a top 1% district and an average-spending school district at the 50th percentile widened by 32% between 2000 and 2015.
Sprawling away from low-income communities
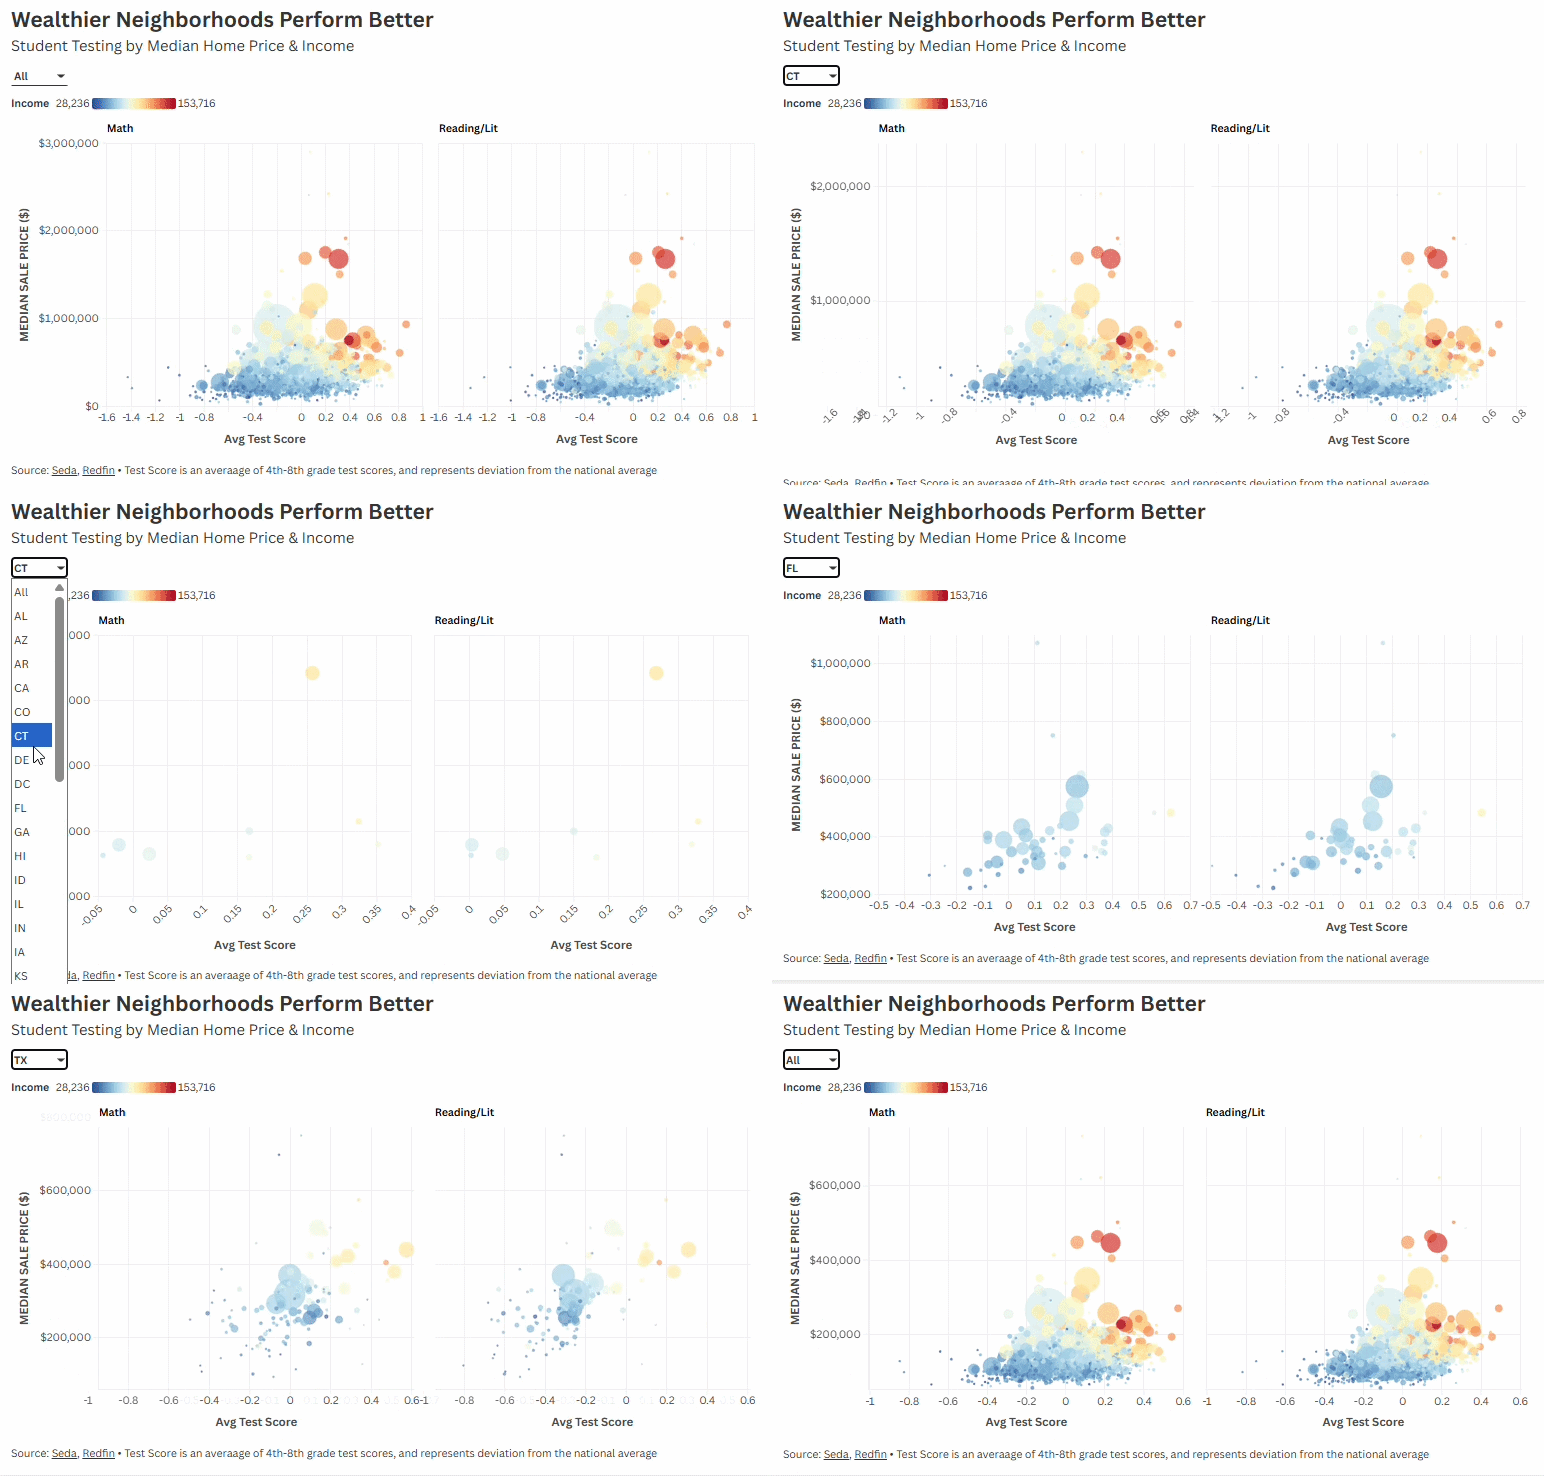
Do rich families just have more means to move to areas where better teachers are already located? Are the schools established in a place and then wealthy families congregate around those institutions? The data shows a bit of a chicken-and-egg problem. More money definitely improves how those schools perform, but wealthy families are constantly monitoring where good school districts are and moving to those.
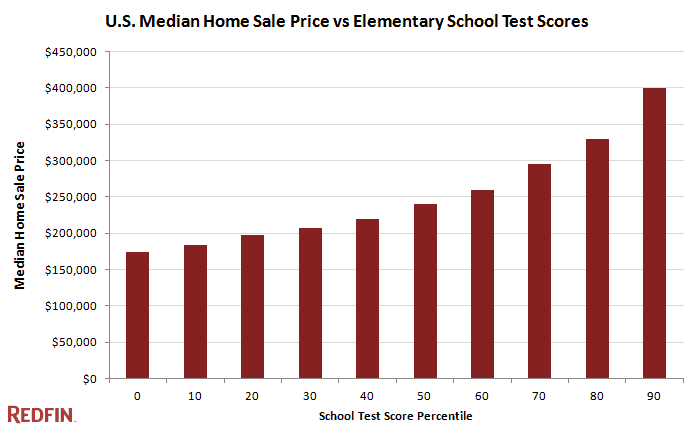
A 2025 study analyzed a 2011 “information shock” in Chicago, when the city publicly released new school safety and support ratings for the first time. In the very next quarter, home prices zoned to the highest-rated schools experienced an immediate 9% to 21% price premium, while incoming buyer incomes in those exact zones jumped by 16%. This indicates that affluent families actively track school quality and possess the immediate capital to outbid middle-class buyers for homes the moment a neighborhood school is verified as “elite.”
In a complementary study from the Federal Reserve, researchers found that parents were willing to pay a 2.5% premium on home prices for every 5% increase in elementary school test scores.
Urban neighborhoods aren’t avoiding school segregation either. Young affluent White families in recent years have moved into urban neighborhoods as well, but urban public schools still have high poverty rates and lower test scores than suburban schools. This is primarily due to wealthy families in urban cities sending their kids to private schools at higher rates than wealthy suburban families. Private school enrollment for high-income families living in urban regions since 1970 has relatively stayed the same, but middle-class families are disappearing.
Even in gentrifying neighborhoods, demographic change does not equate to integration. One study found that among urban neighborhoods that experienced gentrification between 2000 and 2014, student enrollment declined rather than becoming more integrated, primarily when incoming residents were White. In New York City, the White school-aged population in the fastest gentrifying neighborhoods increased from 10% to 29%, yet White elementary school enrollment only increased from 5.7% to 10.4%, suggesting many incoming affluent families remained disconnected from neighborhood schools.
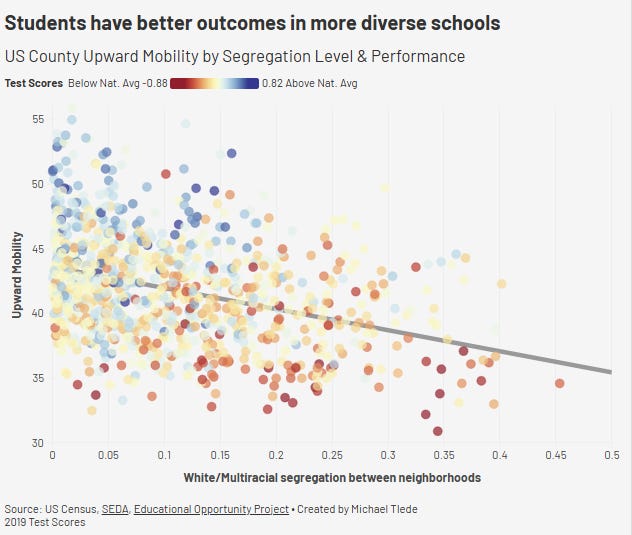
Research also shows that schools with less diversity have worse test scores than more diverse schools. Integrated classrooms encourage critical thinking, problem solving, and exposure to new ideas. Students in integrated schools are more likely to enroll in college, less likely to drop out, and more likely to seek out integrated settings in adult life.
Private Schools are Increasingly for the Ultra Rich
In 1970, 13% of middle-class families enrolled their children in private schools. By 2011, that number plummeted to just 7%. Private schools have become exclusively for the ultra-wealthy, but historically private schools were for the ultra-religious.
K-12 private school fees have increased 553% since the late 1990s, while average incomes grew only 217%, causing the tuition-to-income percentage to rise dramatically for families.
85% of elementary school students in the US who were enrolled in a private school in 1970 were attending a Catholic school. With the decline in religious attendance since then, non-sectarian private schooling increased, along with the price. Between 1970 and 2011 and adjusting for inflation, the average cost for Catholic private schools increased from $873 to $5,858 in 2011 as they lost enrollment and funding, and non-sectarian schools rose from $4,120 in 1979 to $22,611 in 2011.
High income families increasingly secure educational advantages either through expensive suburban housing or elite urban private schools, while middle-class families are excluded from either option and pushed towards more affordable suburban districts. Lower-income students are left concentrated in underfunded school districts with fewer opportunities and limited upward mobility.
The problem is bigger than the phones
We have allowed public education and the real estate market to become so intertwined that it has begun to choke learning outcomes for our children. The classroom crisis in America is now so strongly mapping to the housing-wealth crisis in America, which is actively starving public education based entirely on zip codes.
We cannot continue to blame smartphones or pandemic hangovers for a systemic crisis that we have legally institutionalized. Before screens ever fractured student attention spans, the 2008 housing crash delivered a far more devastating blow to American education, tying test scores directly to a collapsing real estate market.
America needs to ensure that home property values and student success are not attached at the hip. Boston, Denver, New York and other school districts have started using a system where families rank preferred schools. This is put into an algorithm along with schools’ enrollment priorities, student type and random lottery numbers. The output matches students to their highest ranked school with constraints that help to increase integration.
The wealthy are hoarding public resources behind exclusive zoning laws and private school tuition moats all while the middle class is squeezed out and low-income students are left stranded. True educational equality will never be achieved until excellent schools are treated as a fundamental right for every child.