1532 stories
·
2 followers

The Dumbing Down of Advanced Placement Tests

1 Share

Illustration

“We are so proud that our students are yet again leading the nation in AP scores and breaking all-time records. . . . Apples to apples, student to student, across the country, Massachusetts students are at the top, as I want them to be.” —Maura Healey, Massachusetts Governor

“This refinement strengthens the accuracy of our scoring. . . . In fact, AP standards for qualifying scores remain more stringent than grading standards in many college classrooms.” —Sara Sympson, College Board spokesperson

“Students and families are happier because they get college credit. . . . Schools are happier because they look good. Governors and state agencies are happier because they get to brag about it.” —Frederick Hess, American Enterprise Institute director of education policy studies

“We’ll look into anything that might be a discrepancy.” —Pedro Martinez, Massachusetts Commissioner of Education

Massachusetts politicians are celebrating the highest scores any state has ever received on Advanced Placement (AP) examinations, tests used for college admissions and substitutes for college courses. Seemingly, students are better prepared for college than ever before.

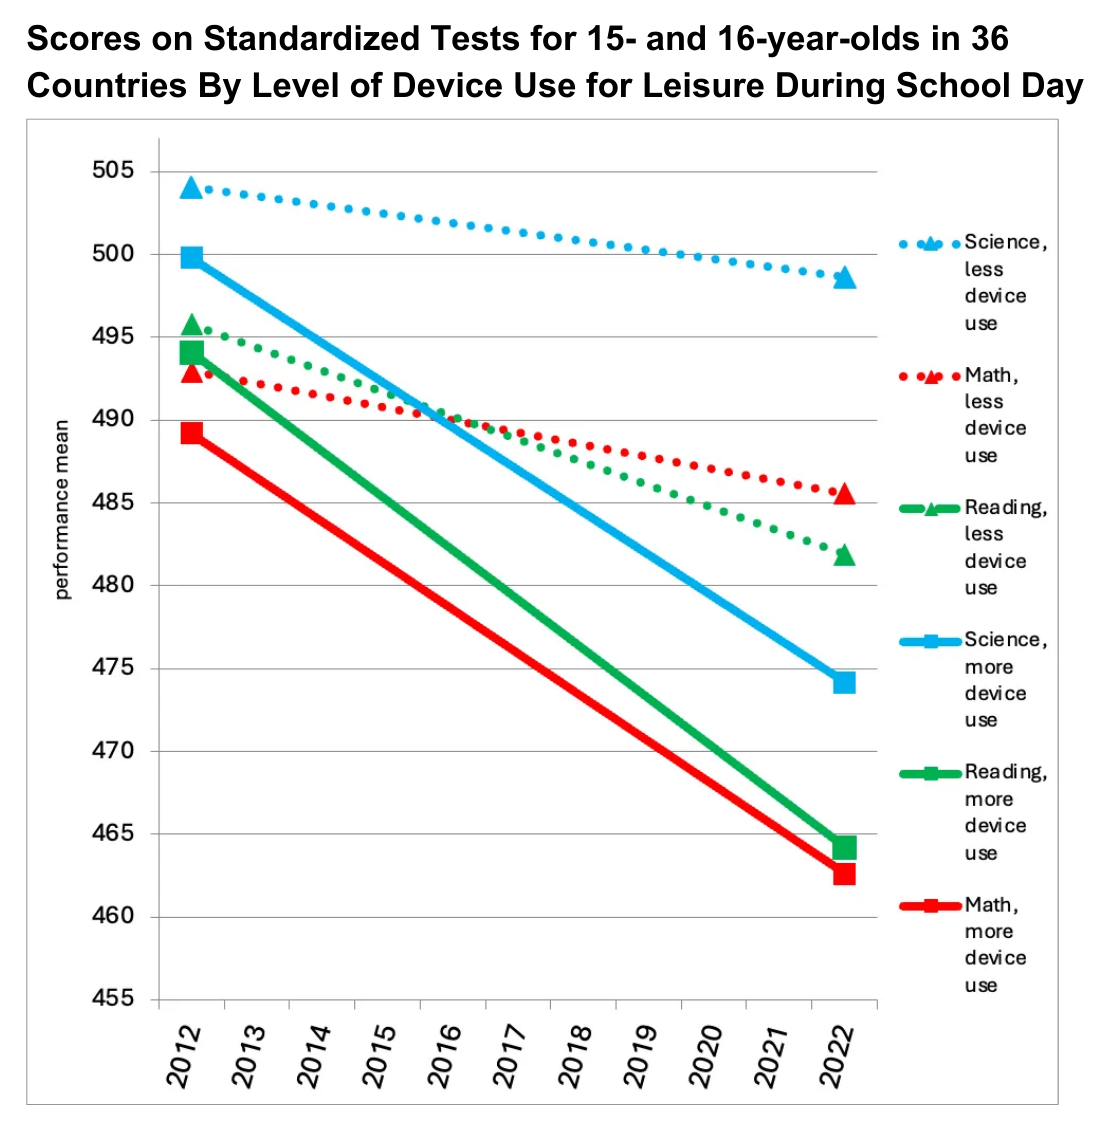
Were it only so. Unfortunately, the higher scores are likely due to easier AP tests, not more learned students. Though Massachusetts students continue to outperform those in other states on the exams, there is no evidence that the performance of the state’s own students exceeds those of students in prior years.

The College Board, the agency in charge of the AP program, admits its questions are easier and passing scores have been lowered on key tests like the English Language exam. They justify the easier tests as an adjustment to a less demanding curriculum in high school and lowered expectations by colleges and universities. In other words, AP is simply adapting to a broad decline in educational standards.

A three-university team of economists has taken a careful look at the detrimental effects of grade inflation for high school students. The trends they show suggest that grade point averages (GPAs) in high school nationally climbed over a half a letter grade from about a “B” to over a “B+” between 1985 and 2020, according to information supplied by the National Center for Education Statistics.

The scholars look at the consequences of these trends by examining teacher grading practices in Los Angeles between 2004 and 2013 and in Maryland between 2013 and 2023. Students taught by teachers who boost grades by one grade level higher than the average teacher are less likely to finish high school and are less likely to enroll in college. They are more likely to be unemployed, and their earnings are lower. The cost to any one student of having just one such teacher runs around $100 a year for the first six years after graduation.  Taking into account the many students taught by each teacher, the numbers add up. The scholars estimate the annual price paid by all students taught by an inflation-prone teacher of average-length career and an average number of students in the classroom comes to $213,872. The societal costs are substantial.


EdNext in your inbox

Sign up for the EdNext Weekly newsletter, and stay up to date with the Daily Digest, delivered straight to your inbox.


To provide apple-to-apple comparisons across teachers, the researchers compared teachers working at the same school in the same year. They adjusted for student performance in 8th grade and various background characteristics.

Teacher ethnic and gender characteristics are not correlated with grade leniency, but weaker teachers are more likely to inflate grades than more effective ones. Also, those at the beginning of their career are more likely to be lenient than those with more classroom experience. Grade inflation may be used to ease students’ disappointment with their class or as a mask to disguise how little has been taught.

The research team distinguishes between average inflation across all students and “passing inflation,” giving a “D” rather than an “F”. As said, nothing good comes from overall grade inflation. When average grades are inflated across the board, students are less likely to finish high school, go to college, and earn as much as they would otherwise. Passing inflation has some short-term benefits. When students pass, it helps their self-esteem, lowers absence rates, and reduces chances of dropping out. But the study finds little benefit of a passing grade on college enrollment or wages.

The study provides no support for the decade-by-decade grade inflation the College Board’s AP program accepts as inevitable. For the sake of future students, the College Board, state education boards and commissioners, elite universities, and other standard setting institutions must halt this debilitating trend in American education. Harvard is talking about taking steps to halt its steep inflation rate, but exactly what actions will be taken remains unclear.  It is tempting to blame individual teachers, but they worry their students will be placed at a disadvantage if they set strict grading standards when others do not. It will take strong leadership to reverse direction.

The documentation of the harm that comes from grade inflation is a strong first step to resetting the nation’s standards. An important step toward that goal has now been taken.

Paul E. Peterson is the Director of the Program on Education Policy and Governance and the Henry Lee Shattuck Professor of Government at Harvard University, and a Senior Fellow at the Hoover Institution. He is the writer of the Substack “The Modern Federalist,” from which this post was adapted.

The post The Dumbing Down of Advanced Placement Tests appeared first on Education Next.

Read the whole story
mrmarchant
1 hour ago
reply
Share this story
Delete

Why OpenAI’s New Math & Science Simulations Don't Work

1 Share
An animated GIF showing someone dragging sliders on an interactive about light and lenses.

OpenAI has done something that is, once again, very neat, but not useful for novice learners:

Research suggests⁠ that visual, interaction based learning can lead to stronger conceptual understanding than traditional instruction for many students. When learners can manipulate variables and instantly see the effects, they may be better able to internalize the relationships behind mathematical and scientific concepts.

Type particular questions about math and science into ChatGPT and you’ll see its usual chat, but also an interactive visual display where students can drag sliders back and forth and watch a diagram change. The experience feels frictionless, which maybe sounds great if you work in software, but this is a liability for novices, not an asset.

The OpenAI website contains examples from math and physics. Drag the sliders around yourself. The experience is silky smooth. You can make diagrams morph and dance almost without thinking about them, which is exactly the problem.

Novices need more friction, not less. Learning results from friction. It is a grinding of gears. You learn when you make your old knowledge and new knowledge lock together, reconciling what you know with what you knew. And at every point in that process it is easy to tell yourself, “Yes, I have done it. I have internalized the relationships behind mathematical and scientific concepts,” even if you haven’t.

An animated GIF showing someone dragging sliders on an interactive about the Pythagorean Theorem.

When a novice uses OpenAI’s Pythagorean Theorem simulation, for example, they are much less likely to say, “Ah, I now understand that the sum of the squares of the legs of the right triangle is equal to the square of its hypotenuse” and much more likely to say, “Ah, when I move my hand right and left the square gets bigger and smaller.” Without friction, the superficial insight replaces something substantial. The empty carb replaces the whole grain.

Education research offers us some insight here. Lots of studies demonstrate that immediate feedback is more helpful than delayed feedback, particularly when we’re talking about giving the same test results immediately or several days later. But OpenAI’s diagrams are different. They have more in common with the early LOGO microworlds, where you’d make a turtle move around at your mathematical command. Simmons and Cope (1993) found that, in those worlds, students were more likely to use procedural strategies like trial-and-error when they received immediate feedback than delayed feedback. Kids needed friction to cross the threshold from superficial to deep understanding.

Three pairs of questions from three activities—one that is dynamic "drag this, click this, watch this" and the other that is slower and more reflective. "Why did that happen? What would happen if ... ?"

That finding is why, in our curriculum, we offer students a dynamic interactive and then follow it with something quite static, a question that asks students to slow down, to go beyond their easy conclusions about the interactive, a question that introduces more friction not less. When answering those questions, novices benefit enormously from an agent telling them, “This is good, but let’s think harder about what’s going on.” And, in 2026, there is no agent more effective at coaxing students to endure and engage in that friction than a human teacher. AI can assist those teachers in that work, certainly, but it is still humans who help humans do hard things.

With these interactive diagrams, OpenAI has yet again offered the world a great gift, though perhaps not the one they intended: an opportunity to better understand the challenges of learning, the sophistication of teaching, and the value of human relationship. These interactive diagrams are something that AI can easily do, but they are not, on their own, something that students actually need.

Thanks for reading! Throw your email in the box to get a new post about teaching, technology, and math on special Wednesdays! 👇 -Dan

Featured Comments

Timothy Burke on AI saving teachers time:

But also because there isn’t any evidence of the repurposing of the time saved. That is the yawning void in the discourse of AI boosters: exactly what are they imagining that the saved time will be redirected towards that is a more valuable activity for trained professionals? The reason they don’t want to concretize it is because even if AI automates certain tasks effectively (a big if) AI boosters don’t actually know enough about any workflow or work processes in any existing profession to envision what professionals would rather be doing nor do they understand anything about what the obstacles to doing that work actually are.

So much of the tech and business community believes teaching time is fungible like money. Save money on your car insurance and spend it literally anywhere else. Save time grading papers after school and ... you can’t actually spend that time in school. If AI saves teacher time, well that’s great on its own, but too many people assume that time can transfer from outside to inside the classroom.

Upcoming Presentation

San Diego County friends: on Friday, March 27th I will be at the San Diego Educator Symposium and Publisher Fair hosted by Amplify. Space is limited so register by Friday, March 20, if you’d like to attend.

Odds & Ends

Wess Trabelsi, a lament about education today:

[Generative AI] is crashing into our classrooms at the exact moment when traditional assessment proxies are broken, and more importantly, when students’ hopes about the future are incredibly brittle. We are asking students to willingly engage with the “desirable difficulties” of learning, in the hope that they develop the skills required to direct and audit AI output. Except, we can’t promise them a stable job or a predictable future in return, and they know it.

Freddie deBoer, along similar lines as Trabelsi:

All of this education [in crisis] discourse (all of it, all of it, all of it) is downstream of the reality of the neoliberal turn, globalization, and deindustrialization. We decided that we didn’t want jobs that don’t require a college degree anymore, many people are not academically equipped to get a college degree, and so we manufactured this “crisis.”

We need to name clearly what teachers can and can’t do, and then to wonder why different groups of people tell teachers, “You can fix poverty.” Freddie deBoer makes a compelling argument that a) this isn’t something education has ever done anywhere on a national level, b) there are plenty of other levers—redistributive economic policy and social welfare, for example—that have.

¶ Get in the car, folks. It’s time for a rebrand!

Precision learning is fundamentally different [from personalized learning]. It would enable educators to use technology, data and evidence to identify exactly where a student is struggling, which interventions are most likely to work and how to deliver them effectively and equitably.

Call the program whatever you want. My questions will always be the same: a) what math does it let kids do? b) how does it make use of human relationship? With personalized learning, those answers have been a) math that reduces to a number or multiple choice response, b) before and after the program but not during.

Kip Glazer is a helpful voice—the principal of a large school in the tech center of the world; forward-thinking with AI; realistic about the work of teaching, learning, and leading. She has been putting edtech companies on notice this whole month:

The best tool in the world fails when the workflow around it is broken. When it does not talk to your SIS. When it adds three steps to a process that already had too many. When it was designed without accounting for the fact that a teacher’s day is not a controlled environment. It is a living, unpredictable, deeply human one. [..] Human variability is not an edge case. It is the entire job.

¶ 🎉 S/o to my colleague Ana Torres for winning Best Female Hosted Podcast from the American Writing Awards. Beyond My Years is a great time.

Read the whole story
mrmarchant
1 hour ago
reply
Share this story
Delete

Dancing robot causes chaos at California restaurant and smashes plates in struggle with staff

1 Share
A struggle between restaurant staff and an out of control robot is going viral after the machine went full Terminator.

Read the whole story
mrmarchant
10 hours ago
reply
Share this story
Delete

Phones at School: Less Learning, More Loneliness

1 Share

This article was originally published on Jean Twenge’s Substack, Generation Tech. We thank Jean for allowing us to share it with our readers.

Source: bokan/shutterstock.com

The first evidence we had for the impact of smartphones and social media was for teens’ lives outside of school. Teens were spending less time hanging out with their friends, less time sleeping, and more time on screens, often holed up alone in their bedrooms. That’s not a good formula for mental health, and sure enough, teen depression doubled as smartphones and social media took over after 2012.

But what about during school, where teens spend more than 30 hours a week? Those hours, too, are filled with technology. Sometimes that’s for truly educational purposes — they’re working on an essay for English class, reading a science textbook in an online library, or taking notes in class.

Subscribe now

But not always. Even school-issued laptops often allow access to YouTube and streaming (like Netflix, Disney+, and Peacock), allowing students to sit in the back of class and watch endless hours of entertainment. Others play games. Personal smartphones are also a huge distraction: A recent analysis found that American teens spend more than an hour using their phones during the school day, and almost none of that time is spent on educational activities. Instead, teens scroll through social media, watch videos, and play games. Some take videos of their peers without permission, or sneak off to the bathroom to watch TikToks.

Source: RDNE Stock Project via Pexels.com

Thus, teens are spending about 20% of their time at school not focusing on schoolwork or talking to their peers. That may be one reason why standardized test scores in math, reading, and science have declined since 2012 and why students have increasingly reported feeling lonely at school. Electronic devices are both distracting in the classroom and isolating in the lunchroom. What impact does that have on teens’ learning and on their mental health?

In a recent paper, my students and I looked into these issues in the PISA dataset of 15- and 16-year-olds around the world. In 36 countries, students consistently took standardized tests in math, reading, and science between 2006 and 2022. In 2022, they were asked how much time they spent using electronic devices (like phones, tablets, and laptops) for leisure purposes (like social media or entertainment) during the school day. This varied quite a bit across countries, with students in some countries spending hardly any time on devices for leisure during the school day, and others spending an average of more than two hours.

In countries where students spent a lot of time using devices for leisure during the school day, test scores plummeted between 2012 and 2022. In countries where they spent less time, test scores merely slid. Thus there was a significantly larger decline in scores in the countries where students spent more time using devices for fun during school hours (see Figure 1).

Figure 1: Scores on standardized tests of math, reading, and science for 15- and 16-year-olds in 36 countries, by low or high use of electronic devices for leisure during the school day. Note: Controlled for GDP per capita. Source: Twenge (2025) using data from PISA.

Share

The consequences of device use aren’t just academic; they are also social and emotional because device use has displaced students talking to each other during lunch and breaks. In countries where students spend more time using devices for leisure during the school day, the percentage of students who agreed “I often feel lonely at school” rose steeply, with the increase much less pronounced in countries with less leisure device use during school (see Figure 2).

Figure 2: Feelings of loneliness at school among 15- and 16-year-olds in 36 countries, by low or high use of electronic devices for leisure during the school day. Note: Controlled for GDP per capita. Source: Twenge (2025) using data from PISA.

These results show the twin impacts of the leisure use of devices during the school day: declines in test scores and increases in feelings of loneliness at school. They are another piece of evidence suggesting that schools should restrict students’ use of smartphones from bell to bell — not just during class, but also during lunch, breaks, and passing periods. A school where students are talking to each other is less lonely. I recently visited a Milwaukee school with a bell-to-bell no phones policy, and students are now talking, playing cards, and “bedazzling” (had to look that up!) with each other instead of being endlessly absorbed in their phones.

Of course, phones are only part of the problem. The next step is to lock down laptops and tablets so they, too, aren’t being used for social media and entertainment during the school day. Or, especially for younger students, it may be time to go back to paper and pencil — old-school, yes, but with the bonus of no binge-watching YouTube videos during chemistry class. Some states are considering bills outlawing or restricting the use of devices for elementary school students — a welcome step.

Sticking with the status quo means lower test scores and more lonely students — not the outcome any of us want.

P.S. I worked with some truly wonderful undergraduates on the PISA project, which at times seemed endless due to the complexity of the tables (data collected over 22 years across 36 countries). My heartfelt thanks to Spencer Deines, Ellah Fessenden, Lauren Gramse, Julia Lima, Elisa Ruiz, Siri Sommer, and M’Lise Venable.

After Babel is a reader-supported publication. To receive new posts and support my work, consider becoming a free or paid subscriber.

Read the whole story
mrmarchant
13 hours ago
reply
Share this story
Delete

Welcome to the Block Universe

1 Share

Where time is an illusion, reality just is, and you can see yourself as eternal

The post Welcome to the Block Universe appeared first on Nautilus.


Read the whole story
mrmarchant
15 hours ago
reply
Share this story
Delete

How High School Students Rank the UCs

1 Share

It’s conventional for stories about college admissions to focus on the decisions of colleges. They might cover how they’re changing their admissions processes to comply with the letter of the law, or how much more selective they have become, or how they have embraced early decision programs to drive up their yield and thus move up the all-important college ranking lists.

We shouldn’t forget that students have agency too. They choose where to apply and they choose where to enroll. The best way to rank colleges is not by selectivity or yield or reputation but by revealed preference: where do students choose to enroll when they have a choice?

Subscribe now

The challenge with ranking colleges this way is getting the data. National Student Clearinghouse has all the data but I’ve not found anyone using it in this way. Parchment, a company that deals with transcripts, made a good attempt but it seems to have withered away. The last ranking I could find was from 2022 and any ranking list that has Our Lady of the Lake University in San Antonio ranked ahead of Yale is going to lack credibility.

Fortunately, the University of California publishes data every year on the top 25 enrollment destinations for students admitted to each campus. We can use this data to construct a ranking just of UC campuses.

In 2024, 1,876 students were admitted to Berkeley but enrolled at UCLA while 986 were admitted to UCLA but enrolled at Berkeley. Since UCLA “won” 66% of these dual admits it will be rated higher than Berkeley. Meanwhile, Berkeley “won” 92% of dual admits with San Diego (2,879 to 241) so it will be rated higher than San Diego. The theory behind constructing a rating system based on head-to-head results was first developed for chess fifty years ago and is called an Elo rating system after its creator. It now forms the basis of pretty much every sports rating system including, for example, Nate Silver’s new college basketball rankings.

For 2024, we have the results of over 70,000 student enrollment decisions1 which is a huge amount. From them we derive the following ratings:

The actual rating number has no inherent meaning. I arbitrarily set the rating of UC Riverside to 1250 and all the other numbers offset from that. What does matter is the difference between two schools’ ratings because that can be converted into the probability that a dual admit will choose one school over the other. If the rating difference is 10 points (as it is between Santa Barbara and Davis), that means we’d expect 51% of dual admits to choose the higher rated school (i.e. Santa Barbara). If the rating difference is 318 points (as it is between Davis and Riverside), we’d expect 86% of dual admits to choose the higher rated school (i.e. Davis).

We can identify four tiers. Los Angeles and Berkeley are the clear top two. Both of the top two win 90%+ of dual admits against each of the middle four: San Diego, Irvine, Santa Barbara, and Davis. Each of the middle four in turn wins 90% or more of dual admits against Riverside and Santa Cruz. Riverside and Santa Cruz then win 80% of dual admits against Merced.

People rarely turn down an upper tier school to enroll in a lower tier school. But, within each tier, things are not as clear-cut. Irvine loses 62% of dual admits to San Diego but wins 63% of Santa Barbara dual admits and 64% of Davis dual admits. Students have different preferences, driven partly by geography. Santa Cruz actually wins slightly more than 50% of dual admits against Riverside but it has a lower rating because Riverside does comparatively better against Irvine and Santa Barbara than Santa Cruz does.

Rating Changes Over Time

Readers who are used to thinking of Berkeley as the pre-eminent UC campus may be surprised to see it rated below Los Angeles. This is a fairly recent phenomenon. Ten years ago, it was Berkeley that was winning 60% of the dual admits against UCLA. In fact, the three Northern California campuses have each seen their ratings decline by around 100 points over the last decade. Davis used to be rated ahead of both Irvine and Santa Barbara. Now it is below both of them. Santa Cruz used to be clearly ahead of Riverside. Now it is slightly below.

What has changed in the last ten years?

Some of it is changing student preferences. Students have always had a strong preference for attending local campuses. For every UC, the yield from local admits is higher than the yield to the same campus in the same year from admits elsewhere in the state. At UCLA, the yield from the giant local counties of LA, Orange, Riverside, and San Bernardino has gone up from just under 50% to just under 60%. But the yield from the Bay Area and Sacramento has gone up proportionately more, from just over 30% to just under 50%. Meanwhile, Berkeley’s yield from Southern California admits has not risen at all, while its yield from local admits has only gone up a few percentage points.

Another factor is that schools are admitting a greater proportion of their students from Southern California (and hence a lower proportion from the Bay Area). This is not because there are more applicants from Southern California. In fact, the opposite is true. Southern California students are making up a smaller proportion of applicants but a larger proportion of admits. They are getting admitted at higher rates than they used to. With fewer Bay Area admits, more dual admits are from Southern California. Given their propensity to enroll in the local campuses, this drives up the dual admit win rate of the Southern California campuses and hence improves their ratings.

1

If a student is admitted to campuses A, B, C, and D and enrolls in A, we can say that A won separate head-to-head contests against B, C, and D. So the number of enrollment decisions is actually greater that the total number of UC enrollees.


Read the whole story
mrmarchant
18 hours ago
reply
Share this story
Delete
Next Page of Stories