
Where time is an illusion, reality just is, and you can see yourself as eternal
The post Welcome to the Block Universe appeared first on Nautilus.

Where time is an illusion, reality just is, and you can see yourself as eternal
The post Welcome to the Block Universe appeared first on Nautilus.


Before we start, here’s a little puzzle to mark the UK release of the paperback edition of Proof this Thursday:
I generated the following two numbers with AI-written code. Can you work out what number comes next in the sequence?
770487, 216739
I’ll send a signed copy of Proof to whoever comments with the correct answer first*.
*Europe/North America shipping only, I’m afraid!
“Why Do You Still Have a Job?” by
I asked John Mongan, a UCSF radiologist and AI expert, why he still had a job a decade after Hinton’s famous prediction. “The people who were making those predictions understood computer vision but didn’t really understand radiology,” he said. “They were writing algorithms that could tell you that an image was a dog or a sailboat. And they thought that radiology was just doing that for medical stuff. But radiology is a lot more than that.”
The end of the noisy London pedicab by &
A “stage carriage” is better known today as a “stagecoach”. As a result, it’s a law that has more in common with the era of Dick Turpin than modern London that has left us in this mess.
The AI Death Zone: a cautionary tale by
Programmers are not starved of oxygen, they are starved of understanding. They are looking at code they haven’t written, assumptions they never would have made. We only seem to hear these days from those who have summited, but I suspect the AI death zone is piled high with bodies, all with the words “just one more prompt” frozen on their lips.
Don’t Shoot the Messenger RNA by
Flu vaccines have traditionally relied on egg-based production that takes about six months from strain selection to administering a vaccine (assuming we have enough chicken eggs). This time could mean everything in the event of a new pandemic threat. While the threat of pandemic flu is always with us, the recent jump of highly pathogenic avian flu (H5N1) from birds to mammals like cattle and ongoing widespread transmission makes this at least slightly more likely at the moment.
Towards a science of AI agent reliability by &
Safety-critical engineering fields (aviation, nuclear, automotive) figured out decades ago that reliability is not the same as average performance. These fields independently converged on the above four dimensions: consistency, robustness, predictability, and safety (the frequency and severity of failures).
For example, nuclear reactor protection systems must respond identically every time conditions warrant shutdown. Automotive safety testing evaluates responses to sensor failures and adverse weather.
My go-to career advice for PhD students and postdocs is to never ever let fear discourage you, and to never set any limits to what you can accomplish. It’s not that you won’t encounter practical limits in the future—you will—but you currently have no idea when and where and no way of knowing except for trying.
my week with the AI populists by
The data centers are just so close to where people live, looming over suburban backyards and sports fields and sidewalks and schools. Two years of loud construction, two decades of noise. You stand there and hear them hissing, whirring, rattling, beeping. Some have cheap American flags draped over the side, and others are painted a bland ecru, a flimsy attempt at fading into the background.
What seemed less obvious was that we would, within a few years, be confronted with a closure of both of these terminals. Yet that is the extraordinary set of events that has occurred in the past week. Ras Tanura and Ras Laffan are both closed. I simply couldn’t imagine writing a sentence like that up until this week.
The Real Cost of Running AI by
The raw compute floor for a well-optimized 14B-class deployment is ~$0.004/M tokens at full utilization. APIs charge $0.30–$1.25/M. That gap isn’t margin — it’s the cost of actually running a production service.
It’s conventional for stories about college admissions to focus on the decisions of colleges. They might cover how they’re changing their admissions processes to comply with the letter of the law, or how much more selective they have become, or how they have embraced early decision programs to drive up their yield and thus move up the all-important college ranking lists.
We shouldn’t forget that students have agency too. They choose where to apply and they choose where to enroll. The best way to rank colleges is not by selectivity or yield or reputation but by revealed preference: where do students choose to enroll when they have a choice?
The challenge with ranking colleges this way is getting the data. National Student Clearinghouse has all the data but I’ve not found anyone using it in this way. Parchment, a company that deals with transcripts, made a good attempt but it seems to have withered away. The last ranking I could find was from 2022 and any ranking list that has Our Lady of the Lake University in San Antonio ranked ahead of Yale is going to lack credibility.
Fortunately, the University of California publishes data every year on the top 25 enrollment destinations for students admitted to each campus. We can use this data to construct a ranking just of UC campuses.
In 2024, 1,876 students were admitted to Berkeley but enrolled at UCLA while 986 were admitted to UCLA but enrolled at Berkeley. Since UCLA “won” 66% of these dual admits it will be rated higher than Berkeley. Meanwhile, Berkeley “won” 92% of dual admits with San Diego (2,879 to 241) so it will be rated higher than San Diego. The theory behind constructing a rating system based on head-to-head results was first developed for chess fifty years ago and is called an Elo rating system after its creator. It now forms the basis of pretty much every sports rating system including, for example, Nate Silver’s new college basketball rankings.
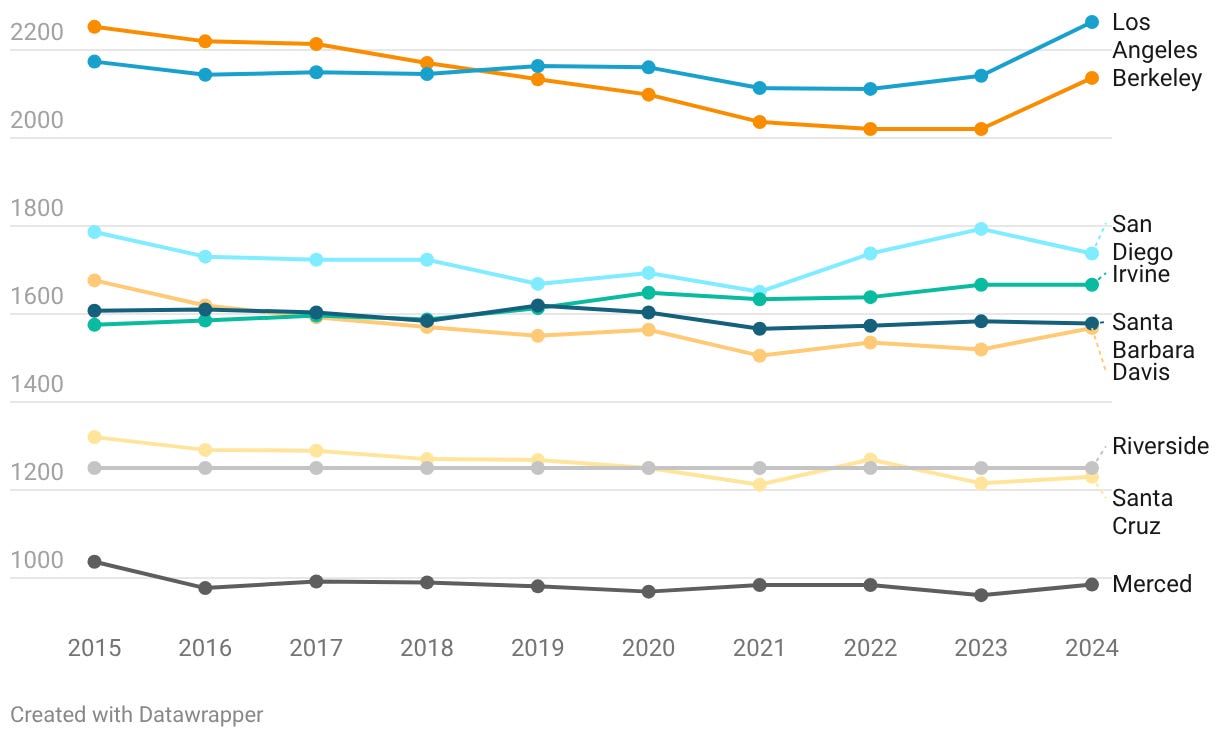
For 2024, we have the results of over 70,000 student enrollment decisions1 which is a huge amount. From them we derive the following ratings:
The actual rating number has no inherent meaning. I arbitrarily set the rating of UC Riverside to 1250 and all the other numbers offset from that. What does matter is the difference between two schools’ ratings because that can be converted into the probability that a dual admit will choose one school over the other. If the rating difference is 10 points (as it is between Santa Barbara and Davis), that means we’d expect 51% of dual admits to choose the higher rated school (i.e. Santa Barbara). If the rating difference is 318 points (as it is between Davis and Riverside), we’d expect 86% of dual admits to choose the higher rated school (i.e. Davis).
We can identify four tiers. Los Angeles and Berkeley are the clear top two. Both of the top two win 90%+ of dual admits against each of the middle four: San Diego, Irvine, Santa Barbara, and Davis. Each of the middle four in turn wins 90% or more of dual admits against Riverside and Santa Cruz. Riverside and Santa Cruz then win 80% of dual admits against Merced.
People rarely turn down an upper tier school to enroll in a lower tier school. But, within each tier, things are not as clear-cut. Irvine loses 62% of dual admits to San Diego but wins 63% of Santa Barbara dual admits and 64% of Davis dual admits. Students have different preferences, driven partly by geography. Santa Cruz actually wins slightly more than 50% of dual admits against Riverside but it has a lower rating because Riverside does comparatively better against Irvine and Santa Barbara than Santa Cruz does.
Readers who are used to thinking of Berkeley as the pre-eminent UC campus may be surprised to see it rated below Los Angeles. This is a fairly recent phenomenon. Ten years ago, it was Berkeley that was winning 60% of the dual admits against UCLA. In fact, the three Northern California campuses have each seen their ratings decline by around 100 points over the last decade. Davis used to be rated ahead of both Irvine and Santa Barbara. Now it is below both of them. Santa Cruz used to be clearly ahead of Riverside. Now it is slightly below.
What has changed in the last ten years?
Some of it is changing student preferences. Students have always had a strong preference for attending local campuses. For every UC, the yield from local admits is higher than the yield to the same campus in the same year from admits elsewhere in the state. At UCLA, the yield from the giant local counties of LA, Orange, Riverside, and San Bernardino has gone up from just under 50% to just under 60%. But the yield from the Bay Area and Sacramento has gone up proportionately more, from just over 30% to just under 50%. Meanwhile, Berkeley’s yield from Southern California admits has not risen at all, while its yield from local admits has only gone up a few percentage points.
Another factor is that schools are admitting a greater proportion of their students from Southern California (and hence a lower proportion from the Bay Area). This is not because there are more applicants from Southern California. In fact, the opposite is true. Southern California students are making up a smaller proportion of applicants but a larger proportion of admits. They are getting admitted at higher rates than they used to. With fewer Bay Area admits, more dual admits are from Southern California. Given their propensity to enroll in the local campuses, this drives up the dual admit win rate of the Southern California campuses and hence improves their ratings.
If a student is admitted to campuses A, B, C, and D and enrolls in A, we can say that A won separate head-to-head contests against B, C, and D. So the number of enrollment decisions is actually greater that the total number of UC enrollees.
I think my most important goal as a teacher is for students to learn that effort leads to learning. This is one place where teachers need to show, not tell. I can tell students to put in their best effort as many times as I like. If students’ everyday experience is that when they put effort in, they don’t learn, they won’t believe me.

Here’s something I’ve done over the last few weeks.
I’m just beginning to teach circumference and area of circles. The area of a circle is especially tricky for 7th graders.1 One piece of notation students need to be fluent in is squaring numbers: knowing that 4² is 16, not 8. Students first learn this notation in 6th grade, but many forget, so it’s worth a review.
A few weeks ago I did a first round of review on squaring numbers. I modeled a few examples, had students try a few on mini whiteboards, gave feedback, and then handed out a worksheet for some practice.2 This whole thing was fast: maybe 5 to 7 minutes total.

Two days later I carved out about the same amount of time. This round I began with a quick assessment on mini whiteboards to see what students remembered. Much of the class did remember, and the assessment helped me figure out which students needed a bit of extra scaffolding. Again, we did some mini whiteboard practice and paper-and-pencil practice, this time with more targeted support based on the assessment data.
The next week we did it again. This time almost every student got it right the first time. Again, some assessment, mini whiteboard practice, and then paper-and-pencil practice.
At this point I started putting questions about perfect squares on our daily Do Now. I gave some extra support to the final few students who needed it. Then we had a bunch of days to improve fluency before we began circles.
All that didn’t take tons of time! A few 5 to 7 minute rounds of modeling and practice, then a few questions on our daily Do Now. That’s it.
My impression is that what I’ve just described is unusual. More common is a quick review of exponents just before teaching the area of a circle. I find that multiple rounds of spaced-out practice and feedback are the best way to get every student fluently squaring numbers. This is important! Fluently squaring numbers frees up mental space for all the other parts of finding area of circles that are hard.
This structure helps students learn the area formula. The extra rounds of practice will also help students when they get to more complex exponent and root problems in 8th grade.
But more important to me is the idea I mentioned at the start of this post: teaching students that effort leads to learning. Here is a place where I can take something that’s fuzzy for a lot of students, and get every student confident in that skill. I can show them that their effort leads to learning.
Here’s a different approach to squaring numbers, an approach I’ve used before.
The first day of finding area of circles arrives. I do a quick reminder of how to evaluate exponents. Some of my students remember right away and have no problem. Others have a faint idea that they’ve been taught this before, but they keep telling me that 4² is 8. I try to address it, but there isn’t much time. We need to move on to circles. We dive into the area formula, and some students keep getting questions wrong because they evaluate the exponent incorrectly. They feel frustrated. They’re trying, but they just can’t get it right. Even when they get the exponents right, they seem to mix up something else in the formula. These students are putting in effort, but the learning doesn’t stick.
I have seen this over and over again in my teaching career. I’m not describing all students. Much of my class will be successful with this type of teaching! But I’m describing a group who is consistently in the bottom 20%. They learn a clear lesson from school: even when they try their best to learn, that effort does not reliably lead to learning. Many stop trying altogether, or adopt an attitude of learned helplessness. Teachers put some nice posters on the wall and we repeat the message that perseverance is important. But it can all feel pretty useless. Those messages are outweighed by the sum of students’ everyday experience.
Leaving a bunch of students behind is hardwired into many approaches to teaching. I often hear people say that teachers should aim for 80% mastery before moving on. If you’re happy with 80% mastery, great. Ignore this post. This post is about how to support that final 20%. If we accept 80% success, we teach that final 20% a very clear lesson: even when they put in the effort, that effort is unlikely to lead to learning.
Taking the time to teach squaring numbers well is just one little example of how I try to help students see that effort leads to learning. Show, don’t tell. Take the time to help every student learn. Don’t stop at 80%. Assess students. Give a bit more feedback. Provide more practice. Structure regular retrieval practice to remind students of what they’ve learned. I do stuff like this all the time, with all sorts of little micro-skills that matter in math.
There’s more to learning math than making sure every student knows how to square numbers. In a few weeks my students will take the state test, and they’ll see questions like this one:
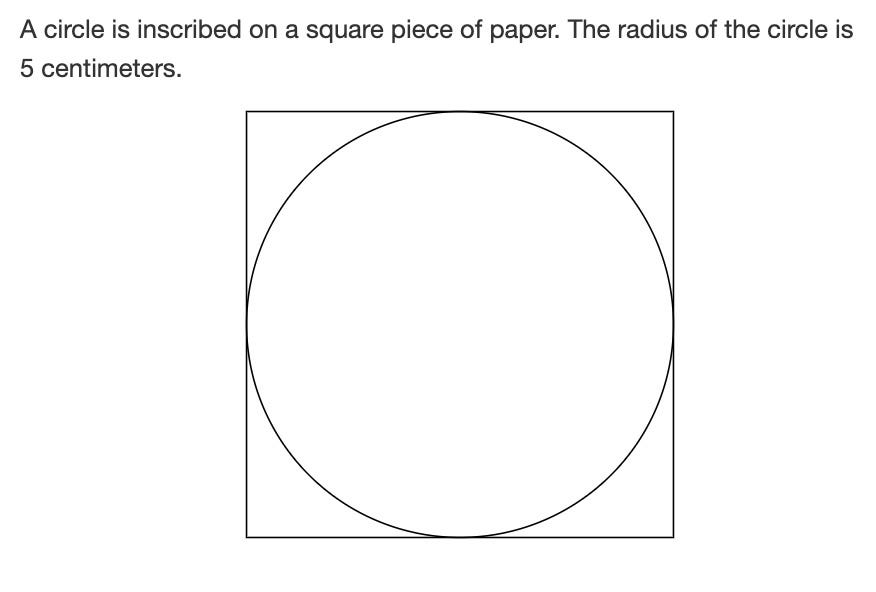
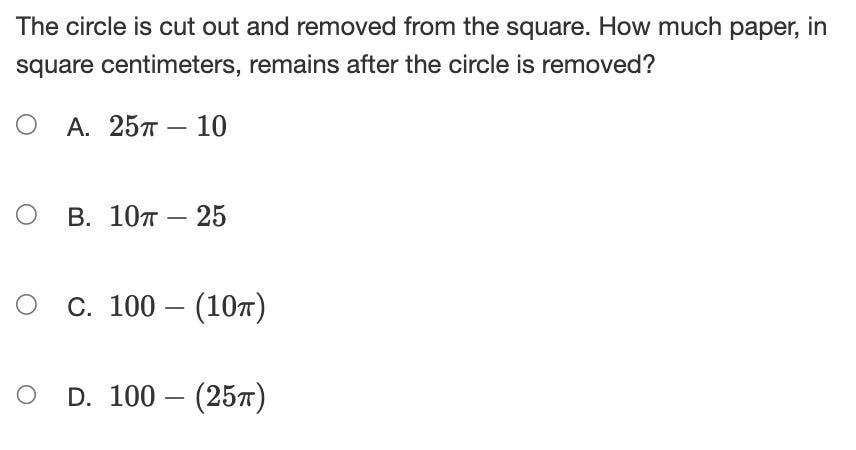
That’s a hard question! I’ll do my best to teach my students how to solve questions like it. I can’t guarantee every student will be able to solve tough questions like this one.
What I can do is guarantee that every one of my students knows how to square numbers accurately, and lots of other similar micro-skills. Those micro-skills are the foundation. If students can’t square numbers, they don’t have much of a chance of getting that tougher question right. Lots of math teachers look down on skills like squaring numbers. It’s rote learning, it’s not relevant, it’s boring. I disagree. Math is worth learning.
But maybe more important, getting those micro-skills right shows students that they can learn math. Successful learning builds confidence, so students are willing to try harder problems like the circle cutout problem above. I’ve taught lots of students who simply don’t believe they can learn. They’ve tried in math, and years of experience have taught them that despite that effort, they just aren’t very likely to learn. My goal is to show students that they can learn, that I’m here to help them, that I’m not going to move on as soon as most of the class gets it.
I’m not a perfect teacher. I’m not successful with every student, every day. But I try, as often as I can, to pick out specific skills and provide a bit of extra practice and a bit of extra feedback, until every student learns. That extra time sends a message to the students who often feel unsuccessful in math class: they, too can learn, and I am here to make sure that happens.
I find that it’s often hard for adults to understand why finding the area of a circle is challenging for students. Here are a few reasons. First, area and circumference of a circle are some of the first formulas students learn. Sure, there are other formulas earlier on for the area of rectangles and triangles or the volume of rectangular prisms. The area formulas are different because this number pi comes out of nowhere. Finding the area of a rectangle makes sense: there are two numbers that delineate the rectangle, we multiply them, that’s it. But with circles, where does the pi come from? Do we use diameter or radius? Why? Why is something squared? There are reasons for all of these things, sure, but that’s a lot for students to keep track of. It all adds up to a much more abstract skill than the formulas students have seen before.
One note about this worksheet: my goal is for all students to complete the left side, which is focused on squaring numbers. The right side has some tougher problems with larger exponents, negative numbers, and equations to solve. Those problems are there to provide an additional challenge. Practice is good for everyone. For students who are already confident, they get to apply their knowledge in a few new ways to stay challenged.
No matter where you look, a bell curve is close by. Place a measuring cup in your backyard every time it rains and note the height of the water when it stops: Your data will conform to a bell curve. Record 100 people’s guesses at the number of jelly beans in a jar, and they’ll follow a bell curve. Measure enough women’s heights, men’s weights, SAT scores, marathon times — you’ll always get the…
I mentioned before how the old-fashioned pixels on CRT screens have little in common with pixels of today. The old pixels were huge, imprecise, blending with each other, and requiring a very different design approach.
Some years ago, the always-excellent Tech Connections also had a great video about how in the era of analog television, pixels didn’t even exist.
But earlier this month, MattKC published a fun 8-minute video arguing that for early video games it wasn’t just pixels that were imprecise. It was also colors.
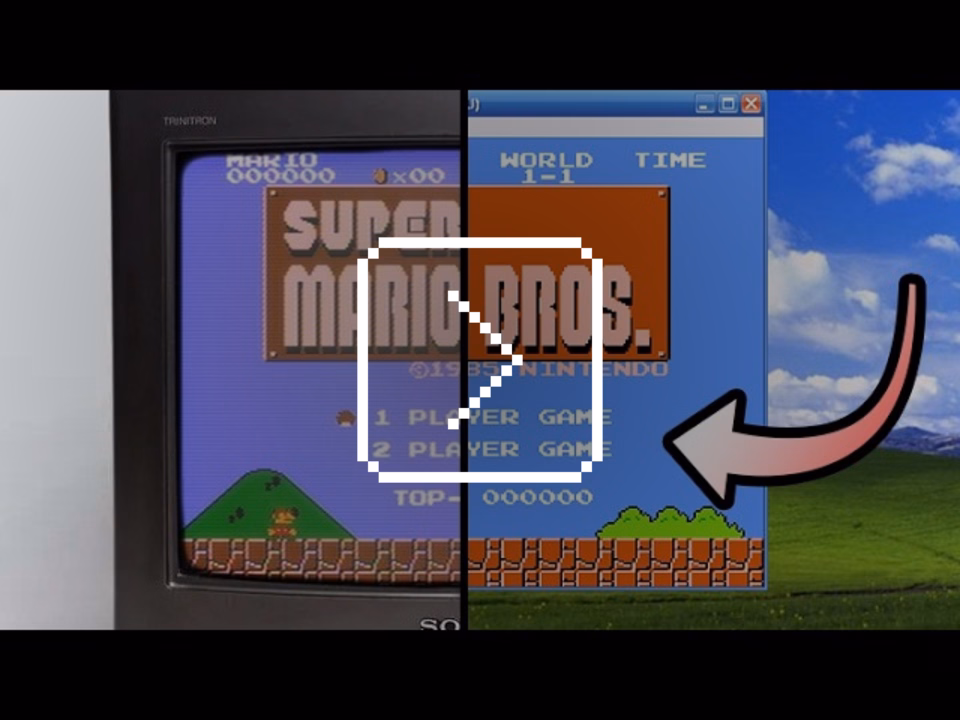
What was Mario’s original reference palette? Which shade of blue is the correct one? Turns out… there isn’t one.
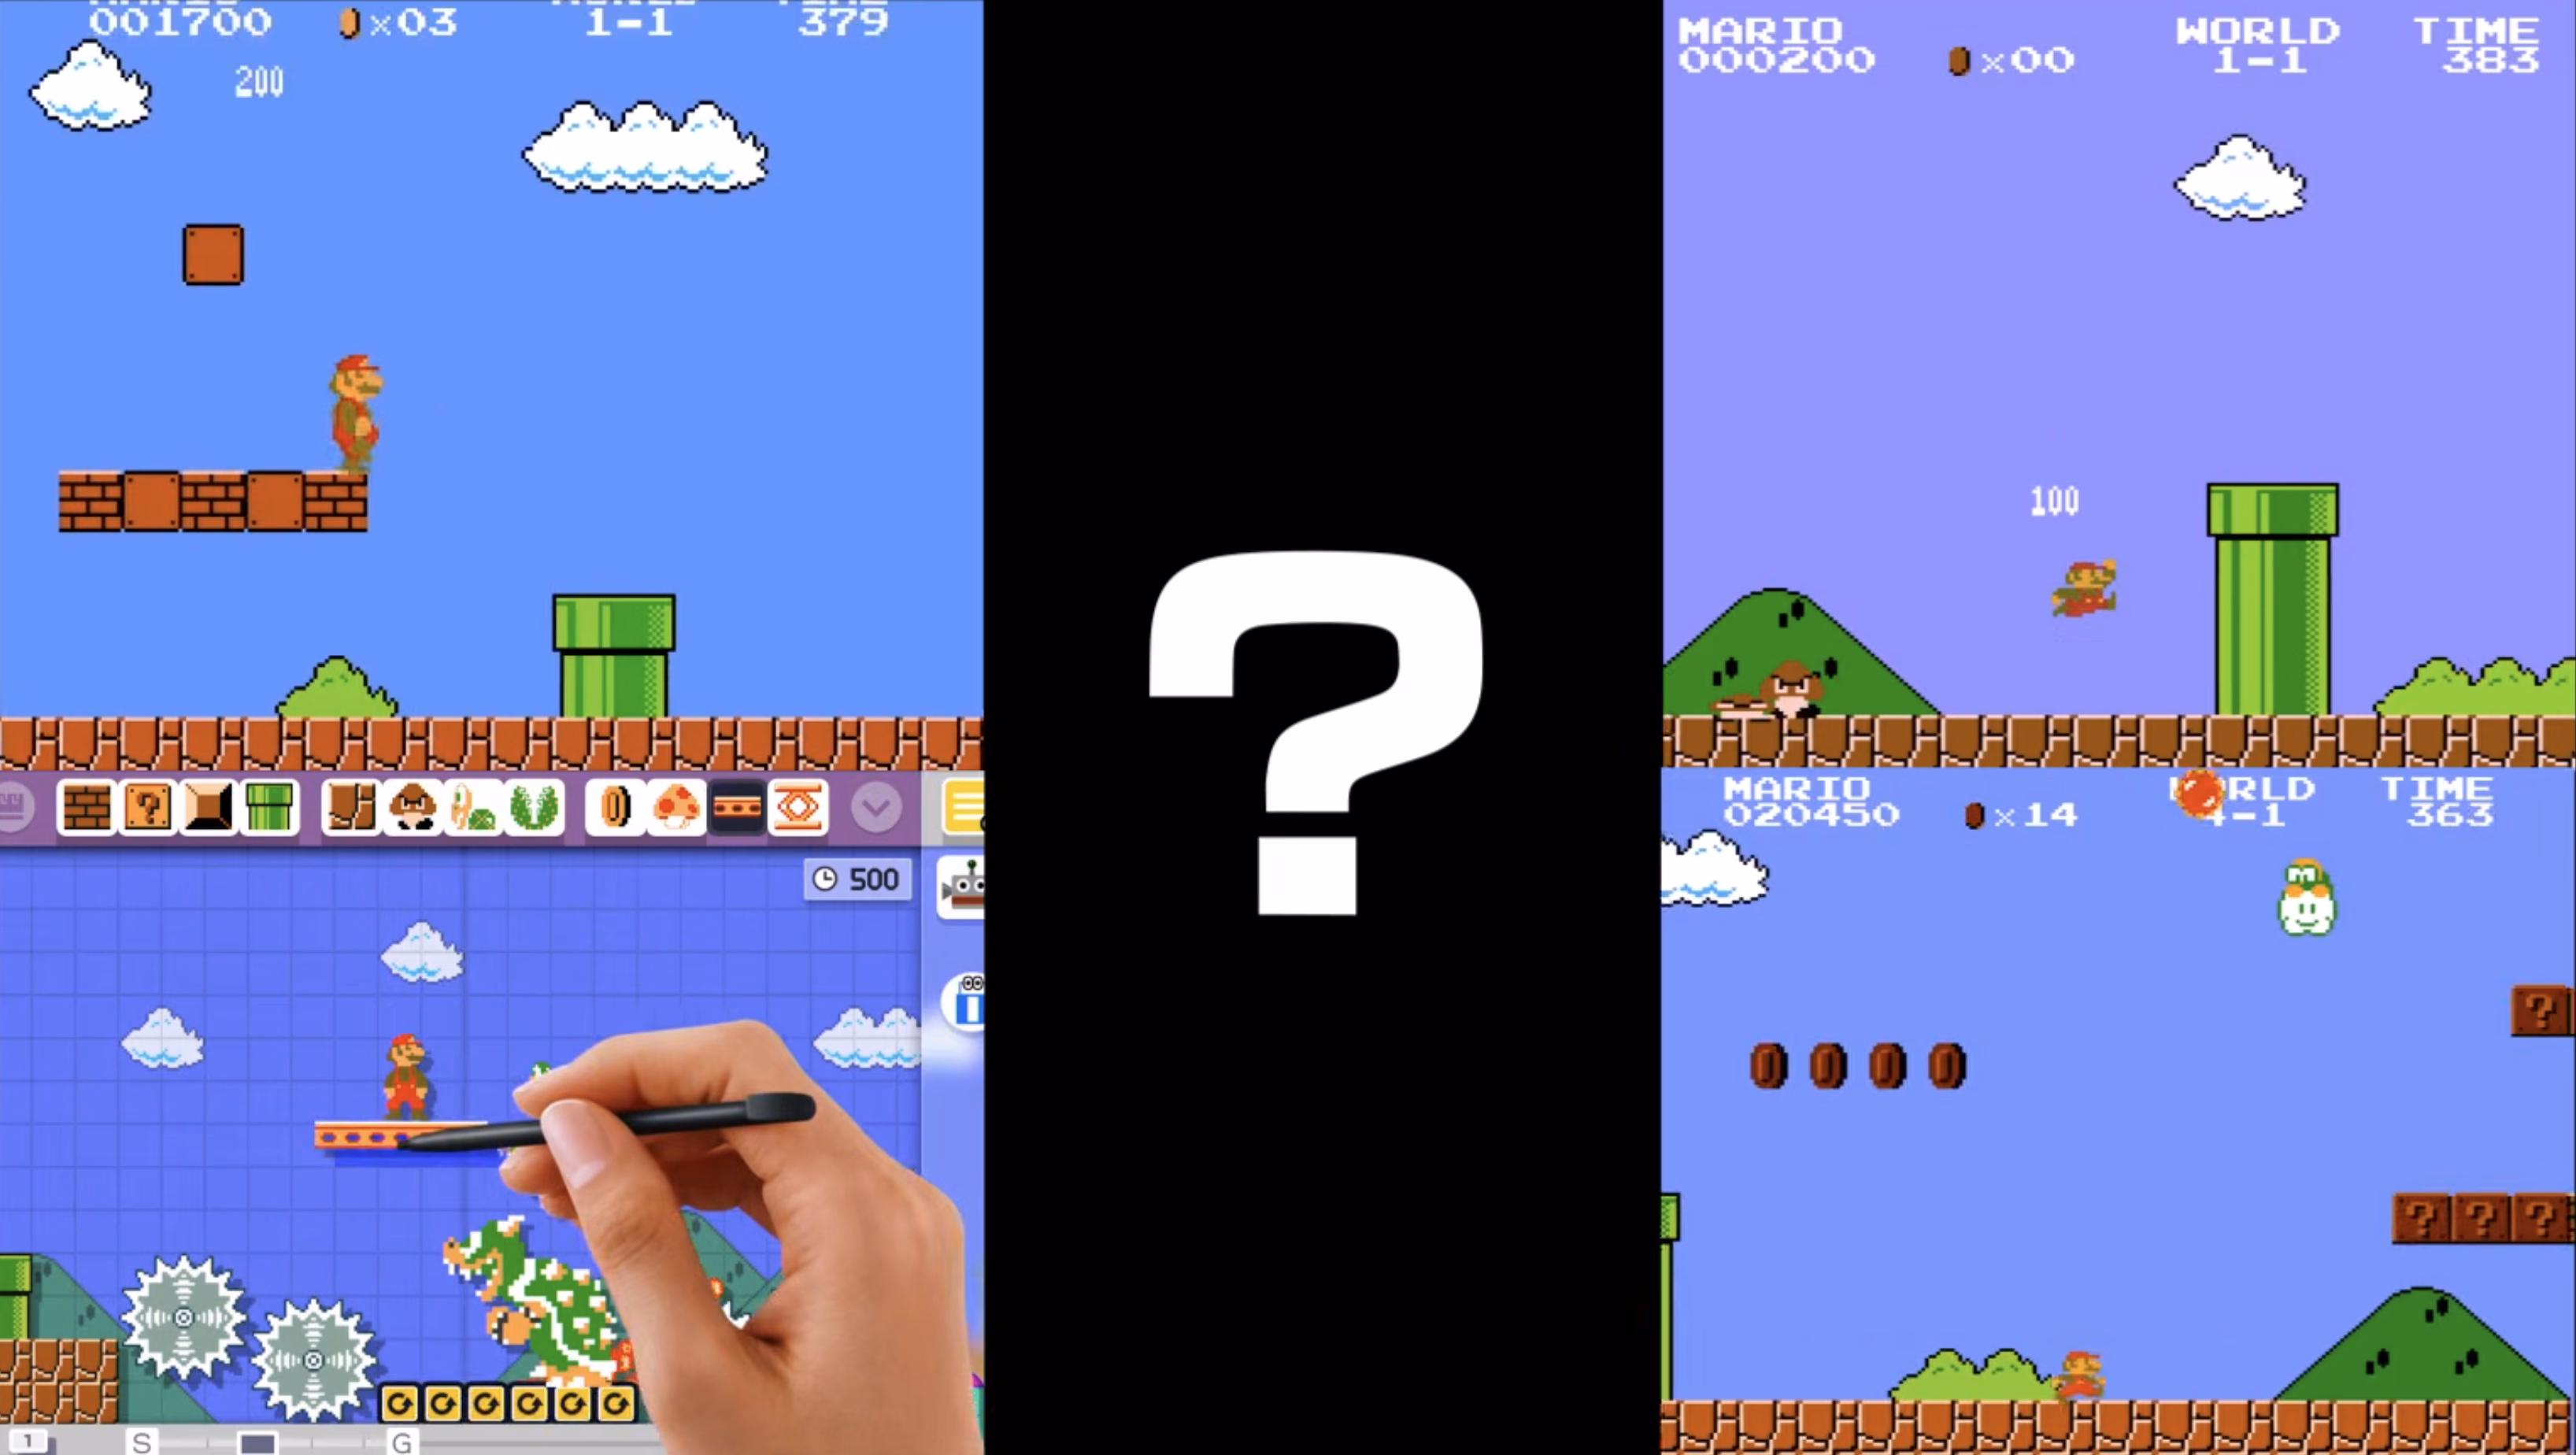
Come to learn some details about how the American NTSC TV standard (“Never The Same Color”) worked, stay for a cruel twist about PAL, its European equivalent.